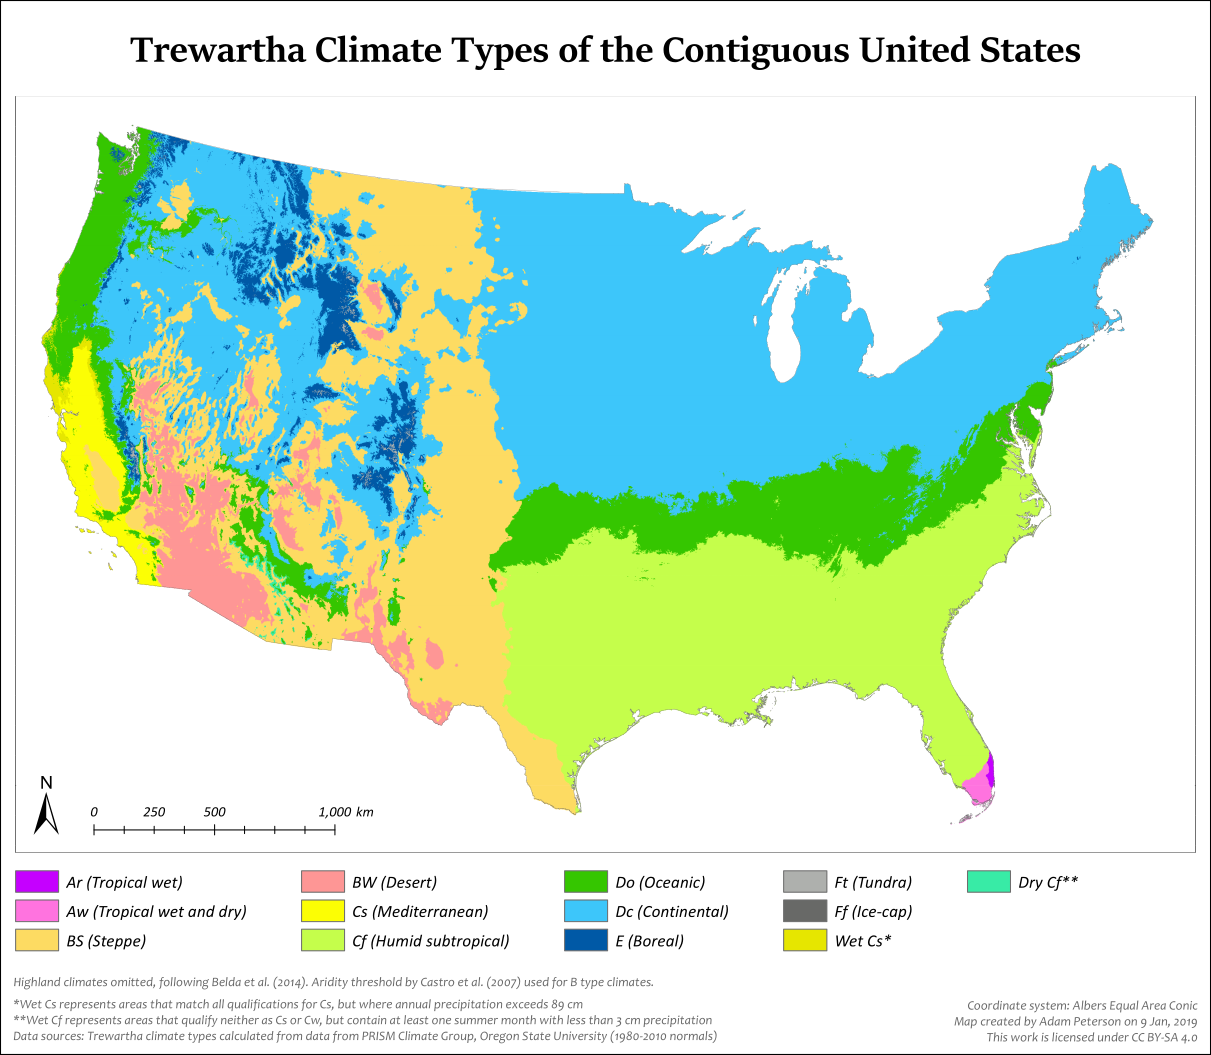
I'm interested in visualizing climate data across the conterminous U.S. to determine regions that I would be interested in living in. So far, I've pulled in NOAA data, and I've:
- averaged the maximum daily temperature measurements per location
- averaged the minimum daily temperature measurements per location
- taken the difference between the average maximum temperature measurements and the average minimum temperature measurements to determine how much weather varies across the year per location
- pulled precipitation in tenths of mm per location
- pulled snowfall in mm per location
At first, these seemed like "good enough" approximations, but I'm discovering that this approach is somewhat inadequate because it is:
- Not appropriately representing swings in daytime-nightime temperatures
- Not appropriately representing the annual variance in temperatures between locations
- using averages
I was initially seeking to discover areas with a high mean temperature, low variance in temperatures annually and daily, and low rainfall. What metrics could I be using to improve this investigation? Thanks!


