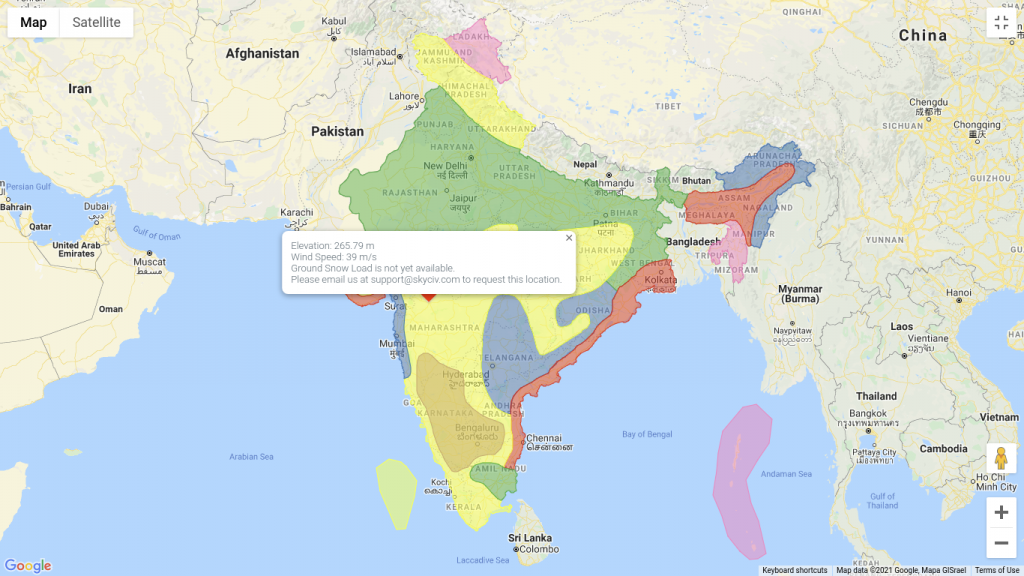
I'm looking for a world map of wind gust climatology data, with the specific purpose of being used for coarse comparison of building design loads, with a consistent metric regardless of location.
Ideally it would be very similar to what's used in building codes, such as "basic wind speed" in ASCE 7 for the US & International Building Code, and comparable codes for other regions: a contour map or heat map of the max value with a 50-year return period (or similar statistic, with various levels for different risk profiles). See the US map here and one for India (below, source).

I have found world maps of other climatology and extreme value data, but none for high-percentile gusts. Most of the global wind data maps are oriented towards power generation. I'm not sure what resolution I need, probably 1- or 2- degree would be fine, but it would have to come from a higher-resolution source to capture local maxima.
What I've already tried/considered:
- The closest I've found is this Dlubal seismic/wind/snow load map explorer - which is super useful and impressive, but doesn't fully serve my need because it's (a) a limited-click web app of a paid program, not a static map or set of maps, (b) does not have all countries, and (c) uses local codes which vary, making initial comparisons hard -although they would be needed eventually.
- I would make my own if I had more time to spend. The data is there at a useful level in several climate re-analysis products, such as MERRA-2 and ERA-5. In particular the Copernicus CDS not only lets you slice and download datasets, but even do the analysis online. I tried to use Panoply to create a view for a single timestep, but simply don't have the experience and time to efficiently do the 24 hr x 365 day x 30 year x 106 gridpoints analysis.
Any pointers are welcome (including on this, my first StackExchange question). Thanks.