TL;DR
The Earth's rotational angular momentum is indeed being transferred to the Moon's orbit. However, this is a very slow process that is barely noticeable even over the course of hundreds of years. That long-term trend is invisible in the short thirty year span shown in the graph in the question. The variations seen in the plot result from transfer of angular momentum amongst components of the Earth (solid Earth, the atmosphere, the oceans, and the outer and inner core) and from changes in the Earth's inertia tensor.
About the Graph in the Question
Regarding that graph, what you are seeing are
- The cumulative effect of transfer of angular momentum to the Moon since the early 1800s, and
- Short-term effects that have nothing to do with that long-term trend.
Regarding the first item, our 86,400 seconds per day is based on the length of day in about 1821. The CGS second was defined in the late 1800s based on data collected over a ~100 year period, centered around 1821. The SI second is now based on atomic clocks, but the definition was intentionally made consistent with that old CGS second. The length of day has increased by about 2 milliseconds since the early 1800s.
Suppose the Earth's rotation rate held steady at one mean solar day per 86,400.002 seconds, the average rotation rate over the last several decades. We would still need to add a leap second every 500 days or so because of that 2 milliseconds increase in the length of day. That's the primary feature you are seeing in the plot shown in the question.
Regarding the second item, the variations during the 30 year span in that plot don't have much to do with the variation over the 200 year span since the early 1800s, and those in turn don't have much to do with the very, very long term variations in length of day due to transfer of angular momentum to the Moon. That very, very long term trend becomes obvious only over the course of many tens of thousands of years or more. Over the short term (a hundred years is "short term" in this sense), various cyclical effects dominate over this very long term trend. The transfer of angular momentum to the Moon is completely hidden in the 30 year span covered in the plot shown in the question. That's just too short a time span to see that transfer of angular momentum.
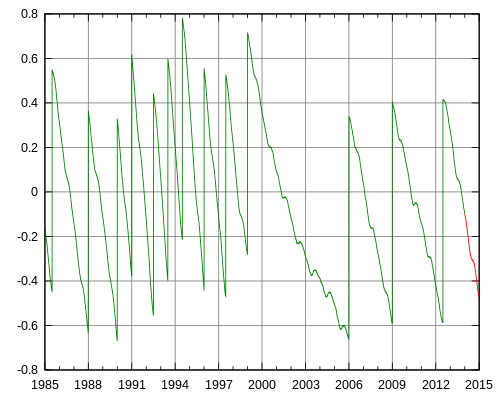
So what is that plot showing? The two most notable features are the long stretch between 1900 and 1998 with almost yearly leap second adjustments and the long stretch between 1999 and 2006 with no leap second adjustments.
Short-term Variations in Length of Day
Those leap second adjustments make it a bit hard to see what's going on. Here's a much better portrayal:
 Source: https://hpiers.obspm.fr/eop-pc/earthor/ut1lod/UT1.html_nov08
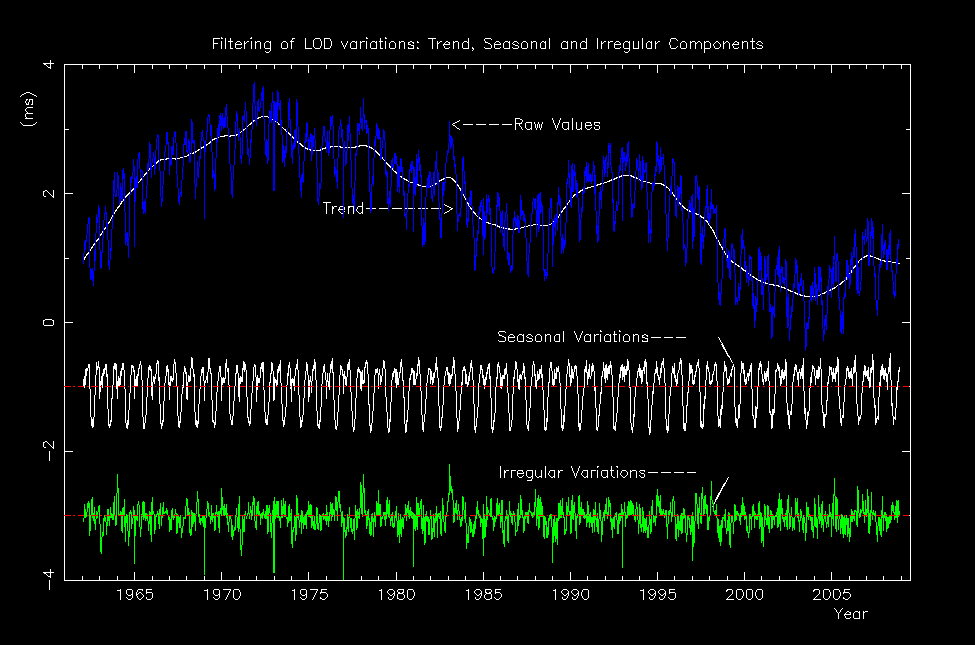
The first thing you should look at in the above plot is the top curve. This is LOD, length of day (better: excess length of day). The length of a day is 86400 seconds and a tiny bit more. LOD is defined to be just that tiny bit more. LOD decreased between 1973 to 1987 and then again between 1993 to 2004. The Earth's rotation rate was very slightly increasing during those intervals.
As mentioned above, angular momentum is being transferred from the Earth to the Moon, but this is a very slow process. What this means is that the Earth's total angular momentum is very nearly constant over the span of years, even decades. Note that it's angular momentum, not angular velocity that is the nearly conserved quantity. Angular velocity can change while angular momentum remains constant. The graph above depicts change in period, and hence change in angular velocity.
The Earth comprises five different rotating systems: The inner core, the outer core, the mantle and crust, the oceans, and the atmosphere. Our terrestrial timescales, UT1 and UTC, are based on the rotation of the mantle and crust only. These five systems do not quite rotate in unison. For example, the inner core is currently rotating slightly faster than one revolution per day while the outer core is rotating slightly slower than one revolution per day. These systems transfer angular momentum amongst themselves.
Some of this transfer is visible in the "Seasonal Variations" plot in the above graph. The mantle and crust transfer angular momentum to and from the oceans and atmosphere on a seasonal basis. What's left after removing those season variations and other high frequency variations (shown as "Irregular Variations" in the above graph) is the white "Trend" line overlaid on top of the blue plot. This white curve shows multi-year variations in the length of day.
Summary
The trend over hundreds of millennia a very gradual increase in length of day due to transfer of angular momentum from the Earth's rotation to the Moon's orbit about the Earth, currently about 2.3 milliseconds per day per century. That's not visible in the plot shown in the question. Over the past several millennia, post-glacial rebound has exchanged less dense ice/water in the polar regions with more dense rock. This reduced the Earth's moment of inertia and thus increased the Earth's rotation rate. Over decades, variations in length of day largely due to interactions between the core and mantle. The inter-annual variations are due to transfers of angular momentum amongst the core, mantle, oceans, and atmosphere. The El Niño–Southern Oscillation and changes in the gravitational field are key drivers in these inter-annual variations.

 Source: