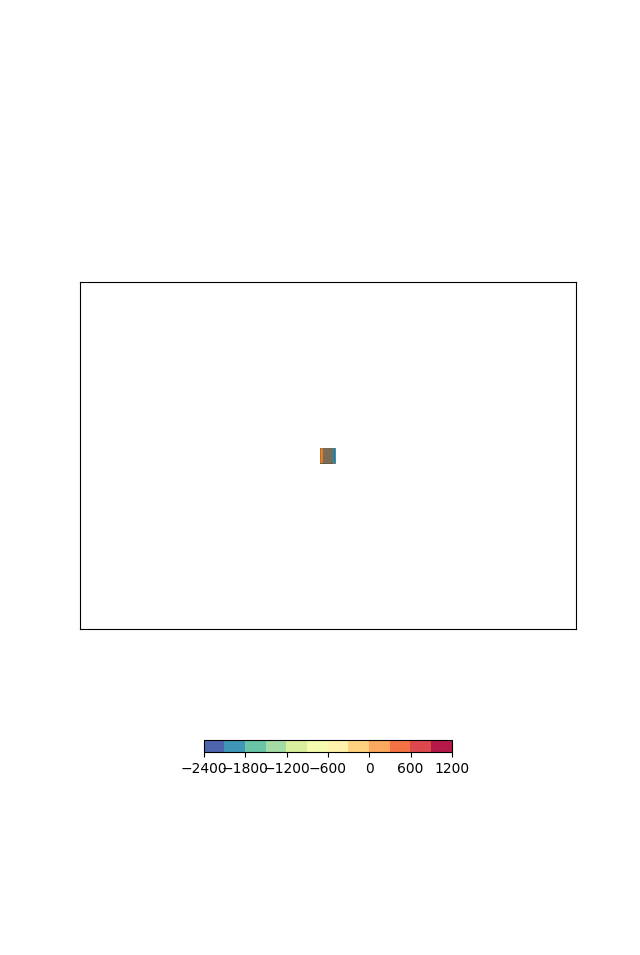
I currently have depth data that I am plotting with the code below. The problem that I am having has to do with the figure python is spitting out. The figure is really tiny. I have tried a few things but nothing came out. Check the code below and the figure. Any help is appreciated.
from netCDF4 import Dataset
from mpl_toolkits.basemap import Basemap
import mpl_toolkits as mplt
import matplotlib.pyplot as plt
import numpy as np

f = Dataset("/Documents/SchoolHR/Data/depth_data.nc")

# extract and label column
lats = f.variables['lat'][:]  # extract/copy the latitude data
lons = f.variables['lon'][:]  # extract/copy the longitude data
depth = f.variables['Band1'][:]
lon_0 = lons.mean()
lat_0 = lats.mean()


#create map projection
m = Basemap(projection = 'stere', width = 5*10**6, height = 35*10**5, resolution = 'l', lat_ts = 40, lat_0 = lat_0, lon_0 = lon_0)

# Plot of global temperature on our random day
fig = plt.figure()
fig.subplots_adjust(left=0, right=1, bottom=0, top=0.9)

# Make the plot continuous
depth_cyclic, lons_cyclic = mplt.basemap.addcyclic(depth, lons)

# compute map projection coordinates for lat/lon grid
# Create 2D lat/lon arrays for Basemap
lon2d, lat2d = np.meshgrid(lons_cyclic, lats)
# Transforms lat/lon into plotting coordinates for projection
x, y = m(lon2d, lat2d)

# Plot of air temperature with 11 contour intervals
cs = m.contourf(x, y, depth_cyclic, 11, cmap=plt.cm.Spectral_r)
cbar = plt.colorbar(cs, orientation='horizontal')
m.plot(x,y)
plt.show()
