6
$\begingroup$

The solar radiation is one of the important factors controlling the formation of $O_3$, and thereby impacting the levels of various secondary species in the atmosphere.

However, in the campaign of ambient $PM_{2.5}$ sampling, I don't have the instrument to acquire the actual solar radiation data. Since the solar radiation can be calculated mainly by the altitude degree of the sun, I turned to find a way to calculate the ideal values in clean sky condition.

I found that pysolar is a potential tool to tackle this kind of issue. By simply defining the location(Lon, Lat), and the date time, the solar radiation in the unit of $W/m^2$ can be generated.

However, the output result here seems to be strange.


Here is an example using Python 3.4:

# Noted that the package can only be implemented in Python 3.4 environment
from pysolar.solar import *
import datetime

# define the location (Beijing, China)
lat, lon = 39.9075, 116.39723

# generate the time series dataset of the solar radiation
start = datetime.datetime(2018, 1, 1, 8, 0, 0, 0, tzinfo=datetime.timezone.utc)

solar_data = []
for i in range(0,24*90,1): # 24 hours x 90 days
    date = start + pd.to_timedelta(1,'H')
    altitude_deg = get_altitude(lat, lon, date)
    solar_data.append(radiation.get_radiation_direct(date, altitude_deg))

solar_ = pd.Dataframe([])
solar_['value] = solar_data

# Plotting
## Before plotting, I found there are a lot of extreme values with the radiation larger than  10e5. I don't know the reasons why they came up, and how to delete those data by conditions. 

solar_.loc[solar_.value>5000, 'value'] = np.nan
plt.plot(solar_.value)

enter image description here

The result seems to be incorrect. In my opinion, the solar radiation should present a clear diurnal pattern with seasonal heterogeneity.

How to explain the bizarre results? Or is there any better solution for the solar radiation data if the monitoring equipment is unavailable.

Any comments or suggestions would be appreciated.

PS: I added the result of altitude degree the same period to response the comment of BarocliniCplusplus enter image description here

$\endgroup$
3
  • 2
    $\begingroup$ It looks like the output of a secant function. Might I suggest checking to see if the altitude angle seems reasonable (like printing it out)? $\endgroup$ Commented Jun 25, 2018 at 17:34
  • $\begingroup$ I've barely ever done anything in Python, so may be way, way off base entirely... but noticed date is odd to not use i (perhaps somehow pd is assumed to iterate because of the loop!????), and also wondering what the ['value] is doing in the solar_['value] line (maybe making a list out of an array or some such thing, but would think you'd want the index not the value??) Anyways, probably useless input, but thoughts (figured why not, with so little reply). Maybe print just a single value before looping/trying to reformat into a graphics package to make sure the issue isn't somewhere in between? $\endgroup$ Commented Jun 26, 2018 at 10:21
  • 1
    $\begingroup$ @BarocliniCplusplus, thanks for your reply, and sorry for the late response. I'll upload the altitude degree data as supplemental information. $\endgroup$ Commented Jun 26, 2018 at 10:29

1 Answer 1

7
$\begingroup$

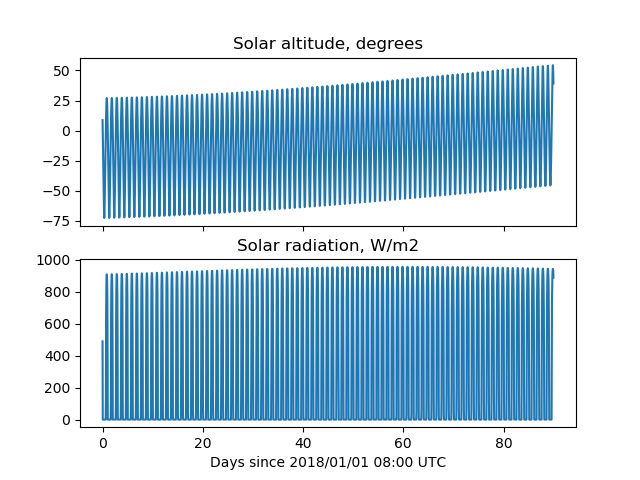
Look at the pysolar docs (http://pysolar.readthedocs.io/en/latest/) under "Estimate of clear sky radiation". The algorithm does not return zeros at night, but instead just plugs those numbers straight in, giving nonsensical values. Filter the results so that if altitude_deg < 0, the radiation is 0. An example just using pysolar, datetime, and pyplot (I don't use pandas, so I can't comment on that) and lists looks like:

import datetime
import matplotlib.pyplot as plt
import pysolar
lat, lon = 39.9075, 116.39723  # Beijing, China
timezone = datetime.timezone(datetime.timedelta(hours=8))  # 0800 UTC
start = datetime.datetime(2018,1,1,tzinfo=timezone)  # 1 Jan 2018

# Calculate radiation every hour for 90 days
nhr = 24*90
dates, altitudes_deg, radiations = list(), list(), list()
for ihr in range(nhr):
    date = start + datetime.timedelta(hours=ihr)
    altitude_deg = pysolar.solar.get_altitude(lat,lon,date)
    if altitude_deg <= 0:
        radiation = 0.
    else:
        radiation = pysolar.radiation.get_radiation_direct(date,altitude_deg)
    dates.append(date)
    altitudes_deg.append(altitude_deg)
    radiations.append(radiation)

days = [ihr/24 for ihr in range(nhr)]
fig, axs = plt.subplots(nrows=2,ncols=1,sharex=True)
axs[0].plot(days,altitudes_deg)
axs[0].set_title('Solar altitude, degrees')
axs[1].plot(days,radiations)
axs[1].set_title('Solar radiation, W/m2')
axs[1].set_xlabel('Days since ' + start.strftime('%Y/%m/%d %H:%M UTC'))
plt.show()

Altitude and radiation plot

$\endgroup$

Your Answer

By clicking “Post Your Answer”, you agree to our terms of service and acknowledge you have read our privacy policy.

Not the answer you're looking for? Browse other questions tagged or ask your own question.