If waves would travel only through a medium while keeping their form (i.e., P-waves remain P-waves and S-waves remain S-waves), you would obtain something a bit like this video: https://www.youtube.com/watch?v=YctV5crEXyM .
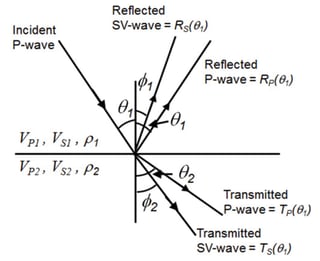
However, standard models for wave propagation are more complicated than that. Upon hitting an interface, P-waves both reflect off and refract into the other material. And if this happens at a bit of an angle, it even generates a reflected and a refracted S-wave (if the material allows it!). Something like this image:

What you see is a P-wave that comes towards an interface between two different media (Vp=P-wave velocity, Vs=S-wave velocity, \rho=density). After hitting the interface, it creates 4 new waves! Two P-waves, two S-waves. A similar figure can be made for an S-wave hitting an interface.
So we can follow a hypothetical wave-path as follows:
- There is a P-wave generated at the Earth's surface that travels down from the crust to the mantle (creating 4 new wave modes as in the figure above; we follow the transmitted P-wave that goes down),
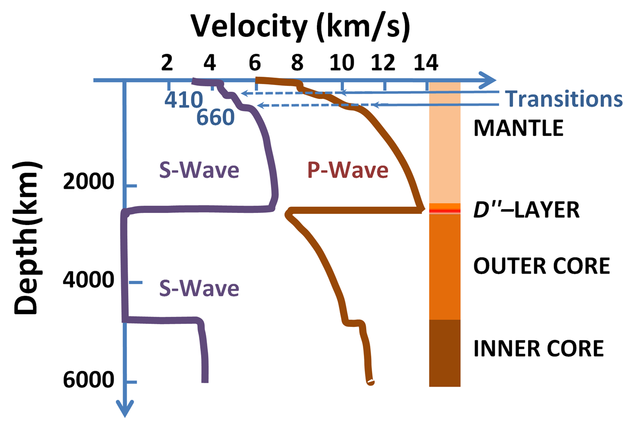
- That wavefront travels from the mantle to the outer core (which creates 3 wave modes because there is no transmitted S-wave! We follow the transmitted P-wave the goes down).
- That wavefront travels from the outer core into the inner core (which creates 3 wave modes, because there is no reflected S-wave; We follow the transmitted S-wave that goes down).
- The S-wave travels through the center of the Earth back up to the interface between inner core and outer core (creating 3 wave modes, because there is no transmitted S-wave; We follow the P-wave that goes up).
- The P-wave travels through the outer core and hits the interface with the mantle (which creates 3 wave modes because there is no reflected S-wave; We follow the P-wave that goes up).
- This P-wave further travels to the Earth's crust and surface (creating more wave-modes in the process), and is measured there.
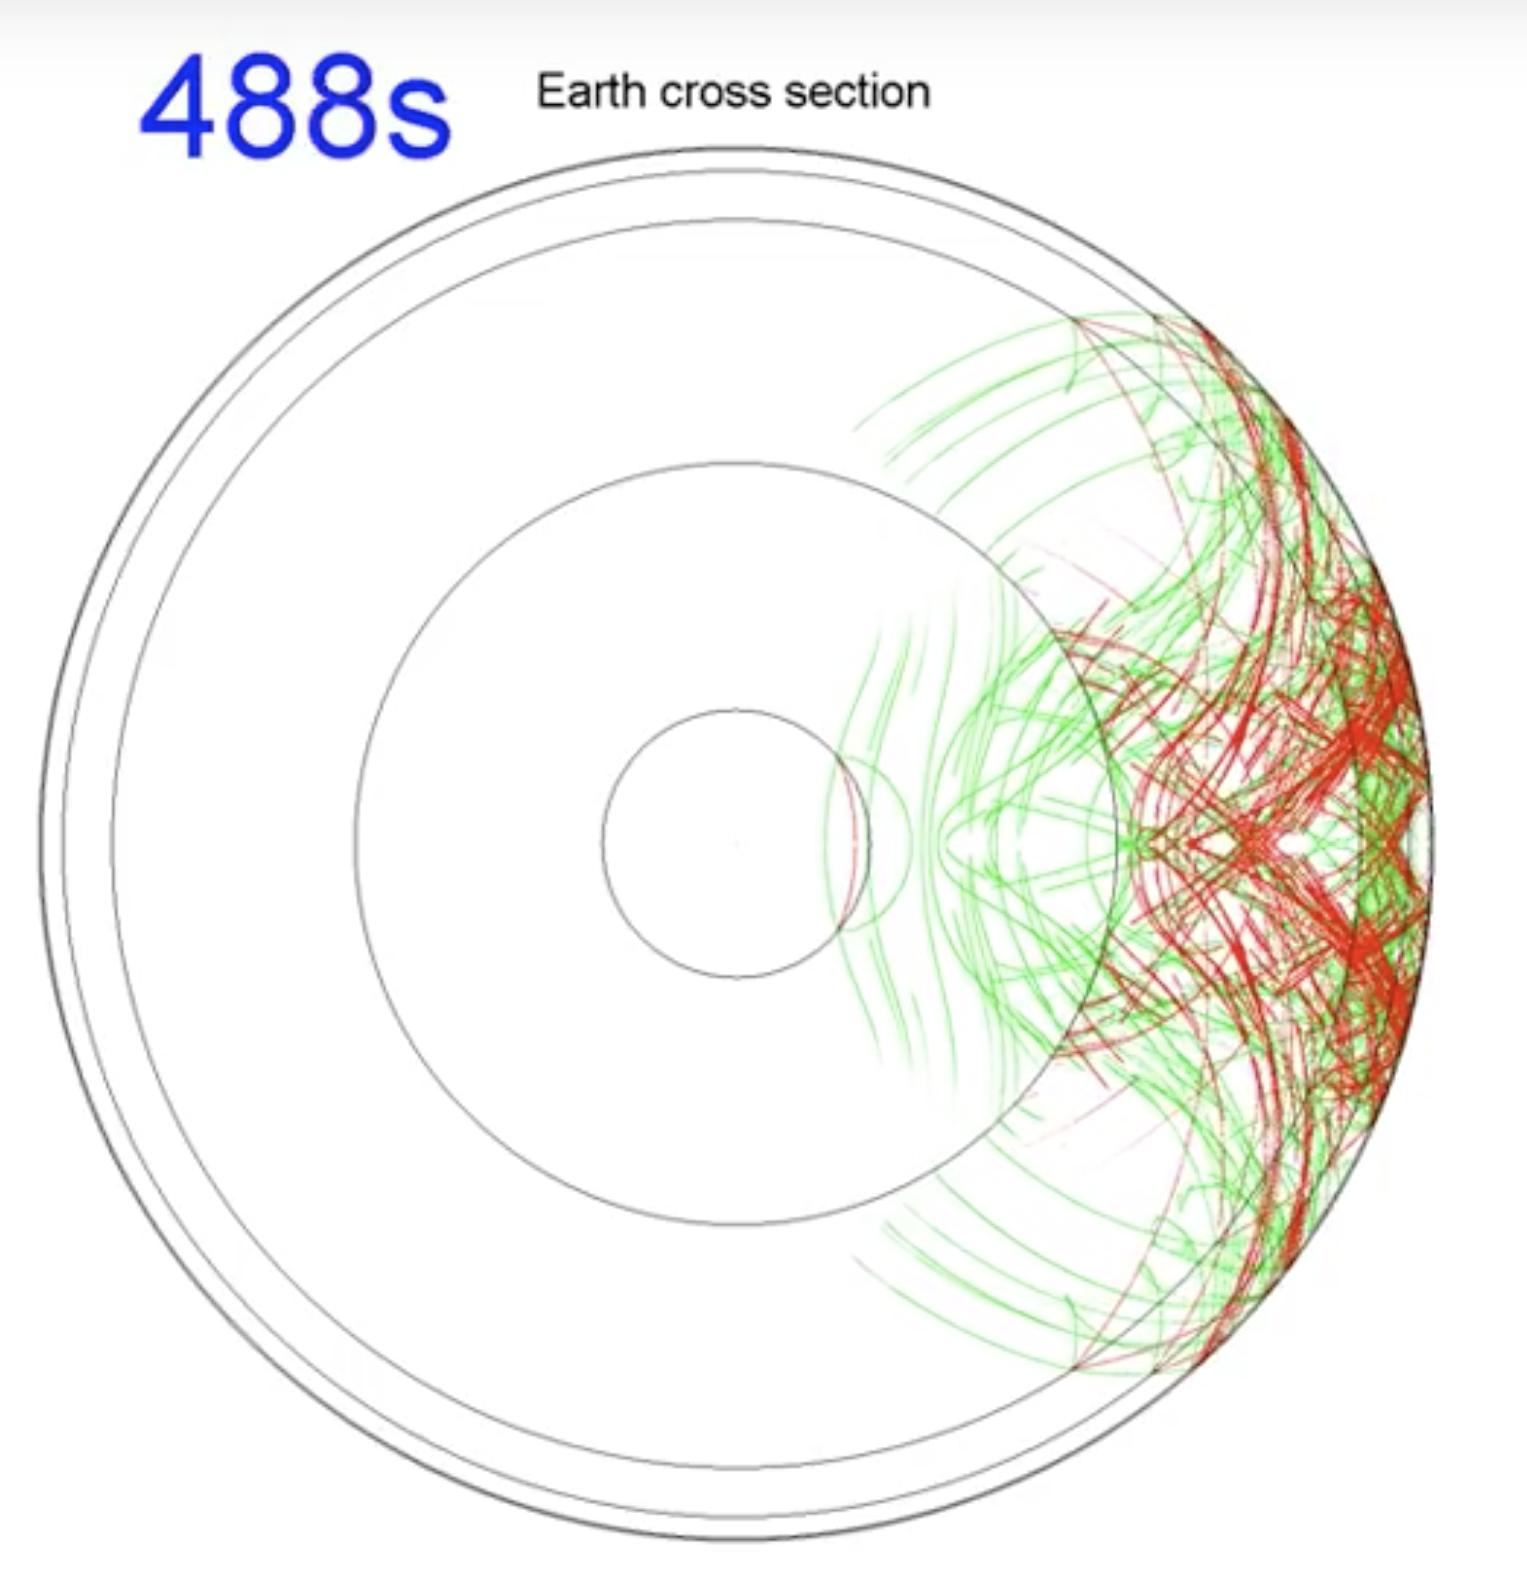
You can see some of these effects in this nice video: https://www.youtube.com/watch?v=j7eoxizmC1I that I put in the comments also. It shows P-waves in green and S-waves in red. You can see how complicated the total wavefield becomes because every interface creates new waves...so it'll be a bit hard to see the particular wavefront I described above, but you can see the general picture.

On this snapshot you see the P-wave (in green) generating an S-wave (in red) in the inner core.
So -- S-waves can exist in the inner core even when the outer core doesn't support them (because waves modes convert, as it's called, at interfaces), and their presence can be measured at the surface. I think that answers your question mostly.
Then, of course, there is still the question of how you'd measure the speed of the S-waves in the inner core, which is rather complicated. These days, it is done by assuming some seismic model of the earth (choosing V_p, V_s, and \rho everywhere within the Earth), and modeling seismic events such as on the linked YouTube video. Then you compare real recordings against your modeled data. If there are particular misfits, you create a new model and you iterate this procedure until your model fits the recorded data 'well'.
So is the shear-wave in the inner core a measured quantity or a deduced quantity? That requires a very careful definition of those terms, so I won't answer that question! Regardless, there exists a shear-wave velocity for the inner core that describes and explains recorded data very well.


