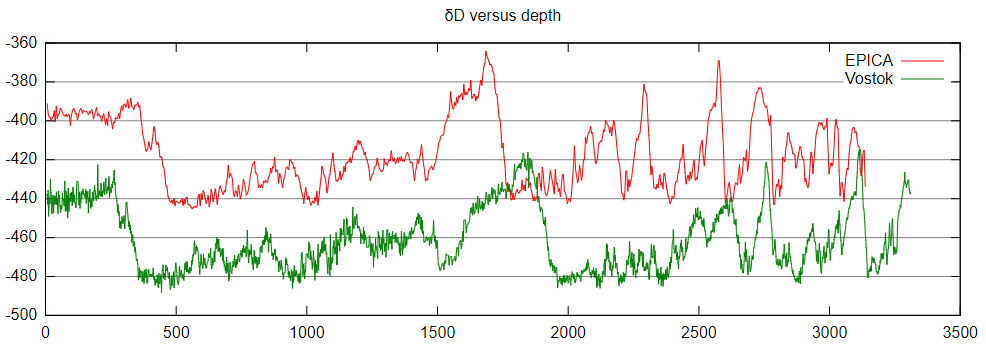
In ice cores a lot of data are measured and analyzed and can be plotted versus depth, for example
- age of layers
- thickness of layers
- concentration of spurious gases
- concentration of solids
- delta signals
I am looking for sources where I can find - ideally at one place - the curves that give the values of these quantities versus ice core depth, e.g. like this
Is there possibly an interactive website where I can even zoom into such curves?
Finally I'd like to know, if there is one set of "equations" which give the estimated (surface?) temperatures and CO2 concentrations as well as amount of precipitation as functions of the measured data. I imagine such equations must exist – or are they too complicated to write down? (The equations should also give the error range! Side question: Does the error range decrease with time (i.e. increase with depth)?)
