23
$\begingroup$

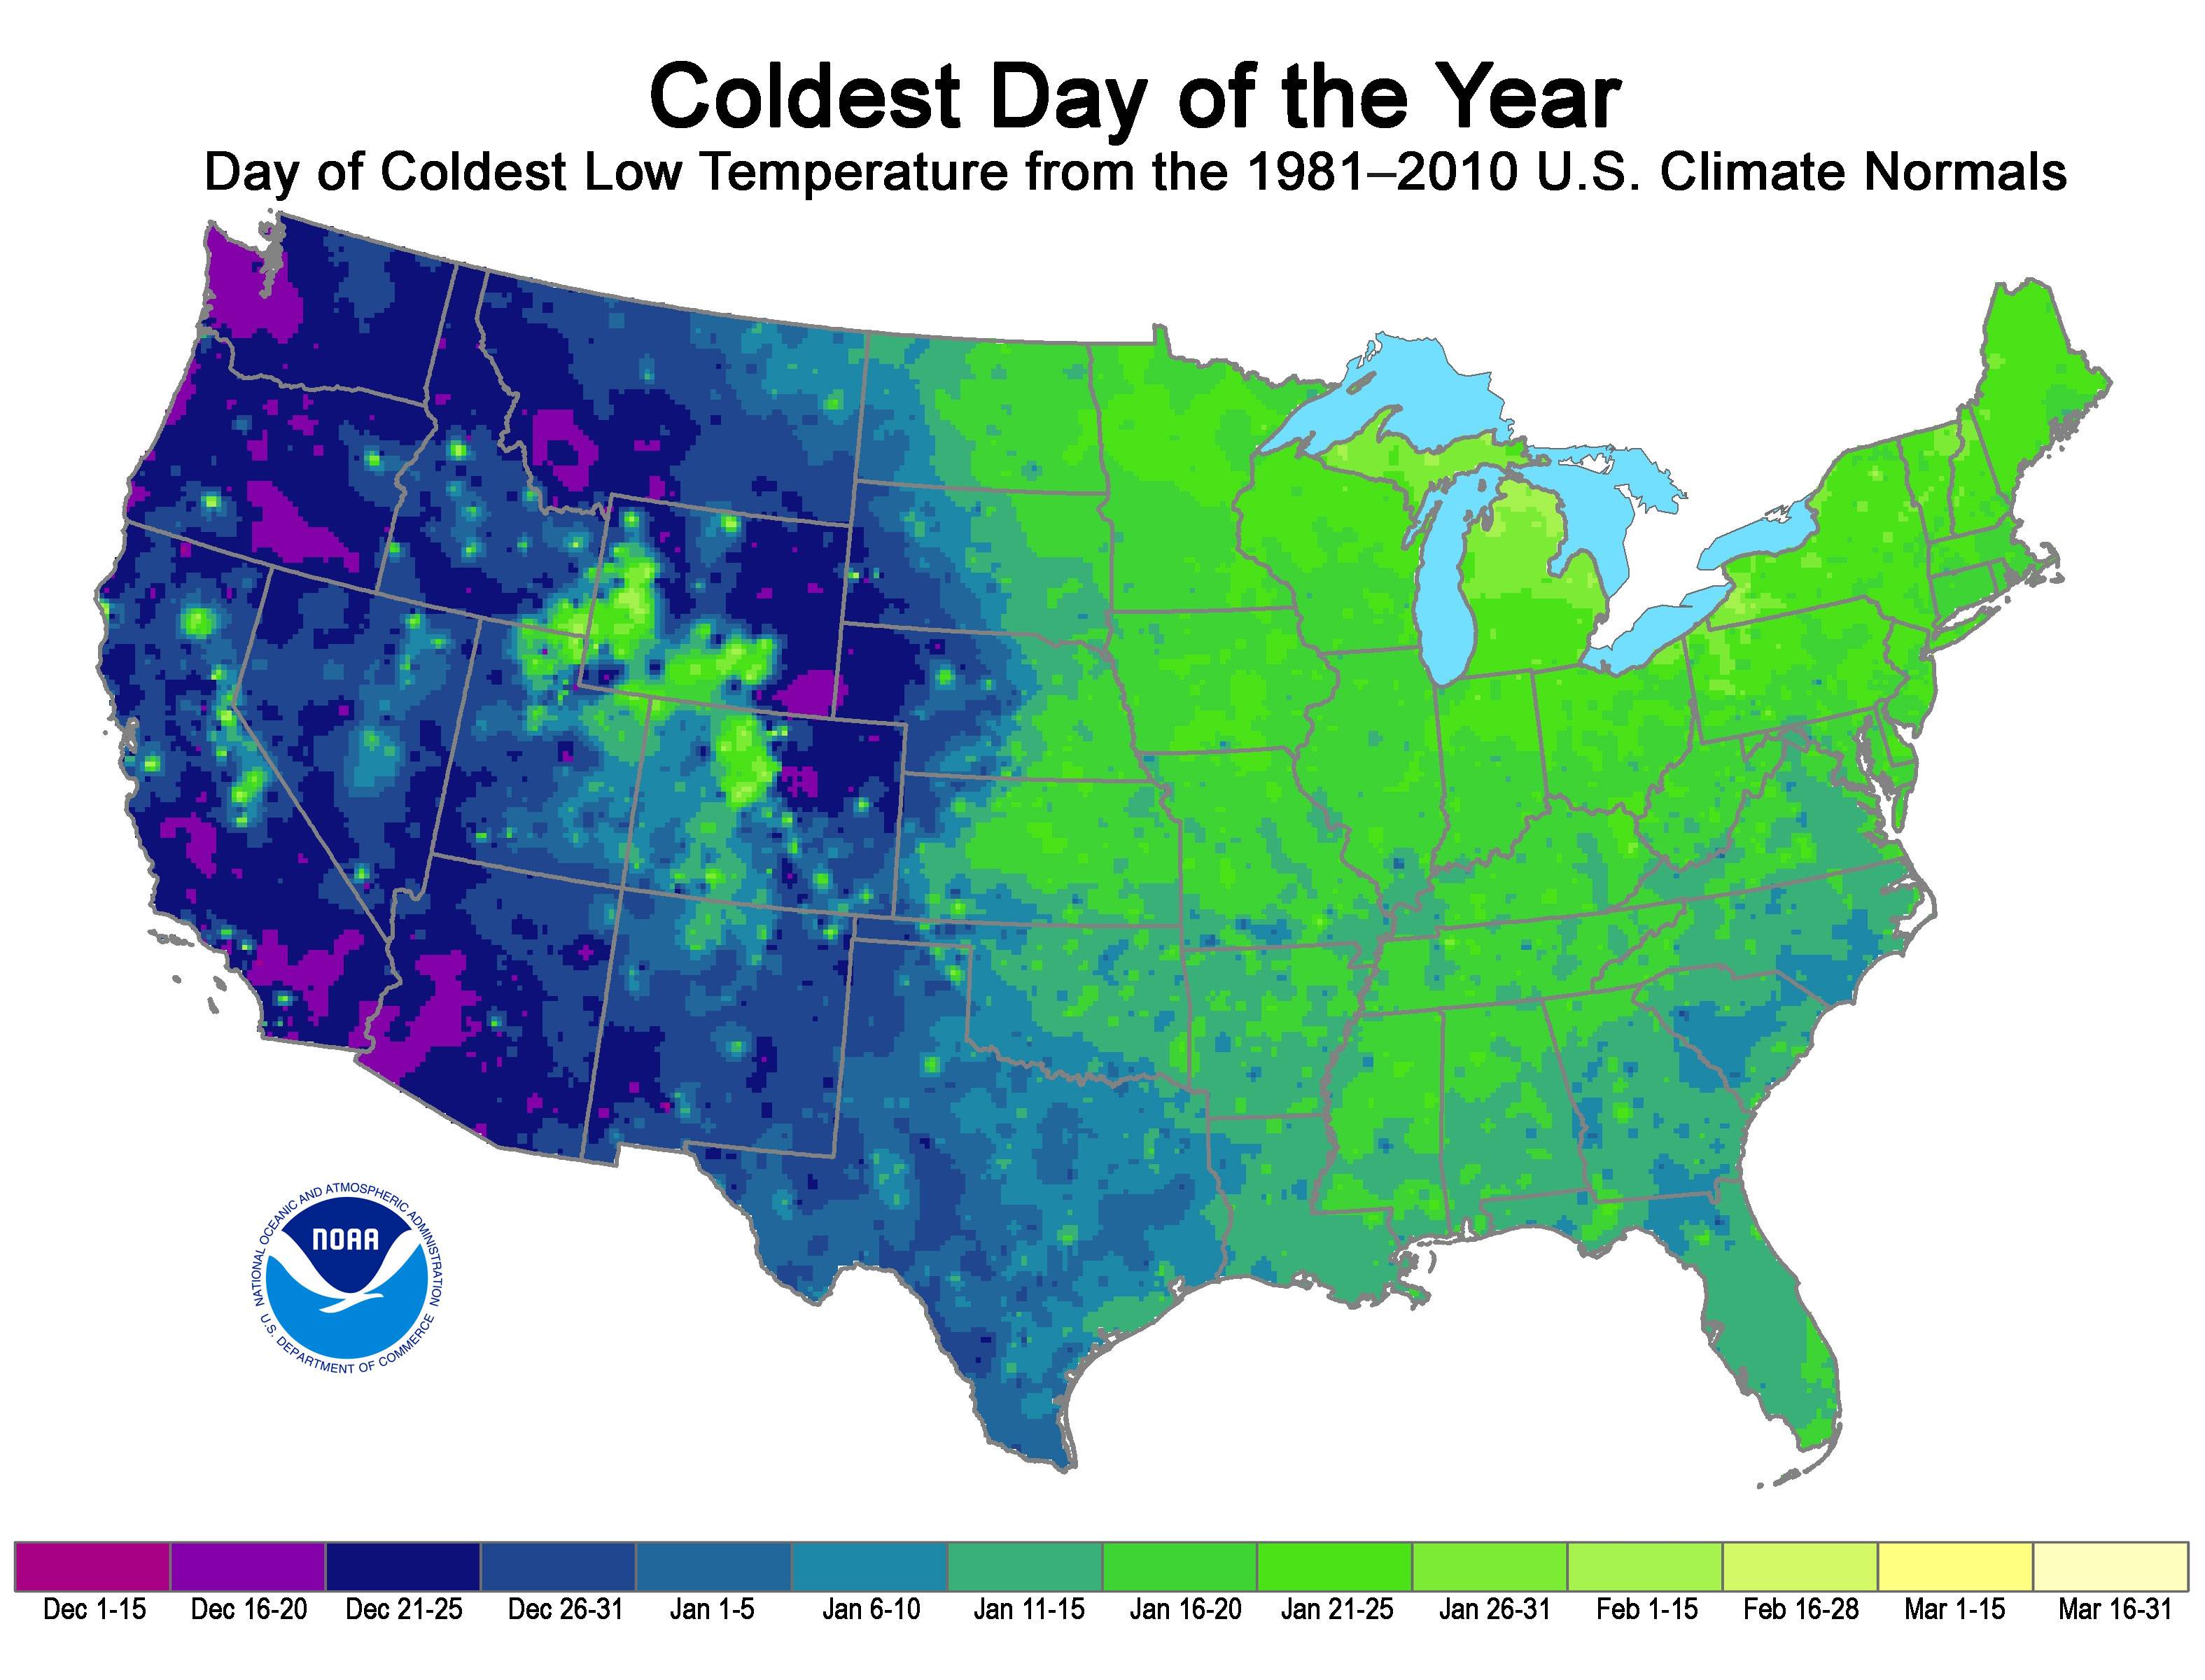
There are parts of the U.S. where, on average, the coldest day of the year comes before December 21st. [source]

Coldest day of the year

How can this be? Why would temperatures start rising again even while days are still growing shorter?

(I would have assumed that daily temperatures should, in general, always lag behind daily insolation, with some sort of hysteresis relationship.)

$\endgroup$
1

2 Answers 2

9
$\begingroup$

I have created composite plots from reanalysis data for the dates as partitioned in the image in the question. I used the full NARR dataset, which covers 1979 to 2014, so I have a few more years of data than is included in the image above.

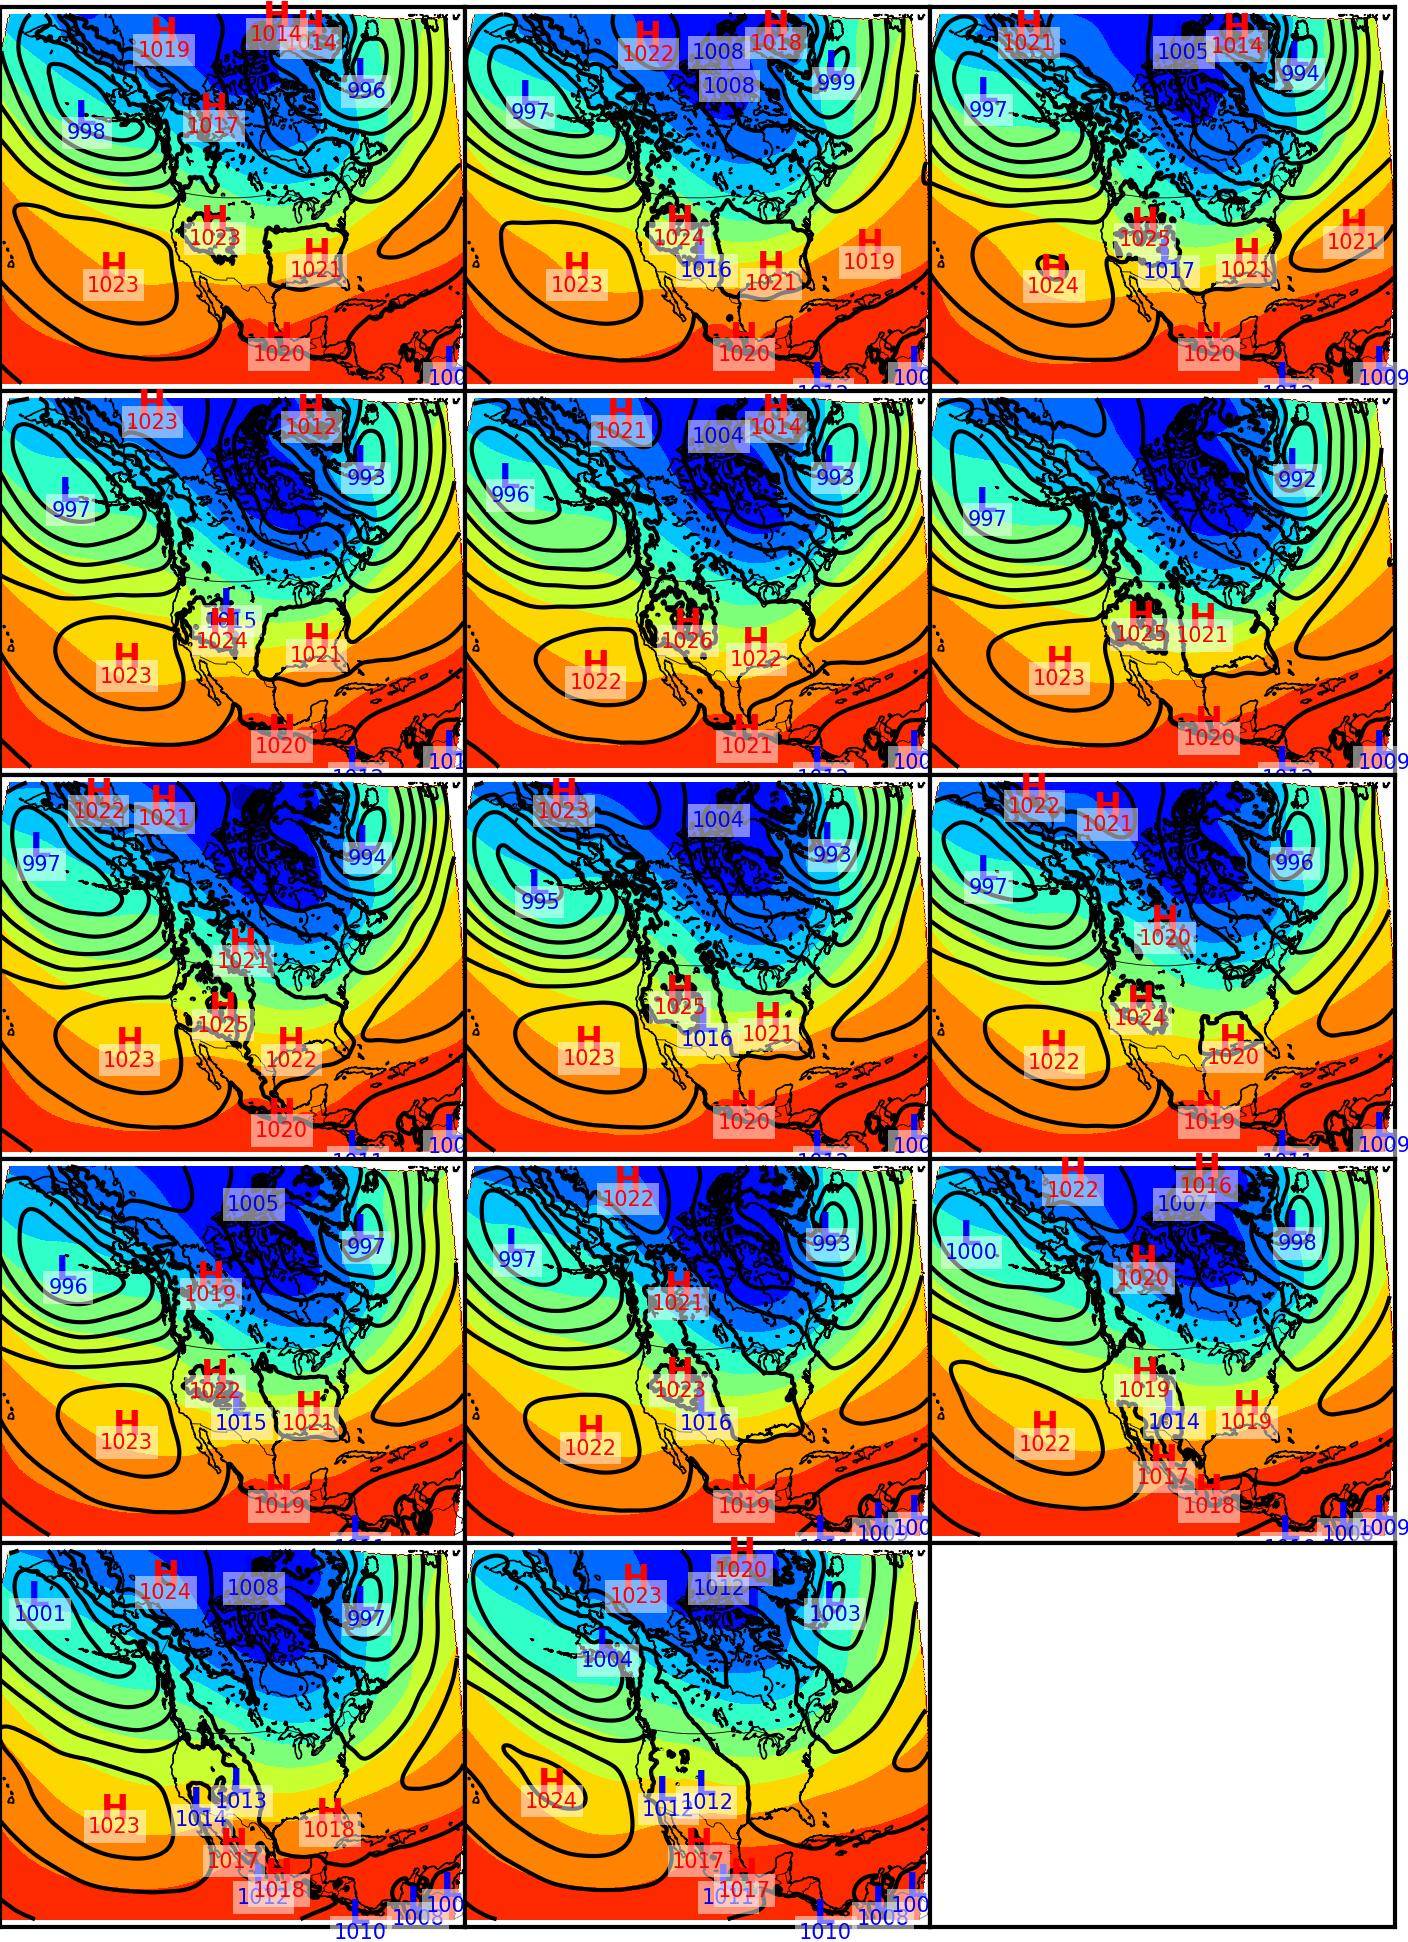
What can be seen are largely wintertime climatological means. A persistent subtropical high off the California coast and persistent lows in the north Pacific and Atlantic. What does change is the mean extent of arctic air which descends into the US as winter progresses and retreats as spring approaches.

Composite NARR MSLP and 500-1000 hPa thickness 1979-2014
enter image description here enter image description here

Figure 1. From left to right, top to bottom the dates composited are Dec 1-15, 16-20, 21-25, 26-31, Jan 1-5, 6-10, 11-15, 16-20, 21-25, 26-31, Feb 1-15, 16-28, Mar 1-15 and 16-31. MSLP is contoured every 4 hPa. Thickness is shaded at intervals of 10 dm. Click the plot for a larger version.

The signal I can pick out of this is the approaching and retreating cold (using the proxy of 1000-500 mb thickness) that seems to correlate well with the latest dates of cold in the eastern US, particularly in the great lakes and northeast.

What I'm seeing in the west is that initially the subtropical high is broad and surface flowing westerlies impinging on the west coast would originate initially at higher latitudes than the do later in the winter. By January the subtropical high and the low in the north Pacific have re-oriented so the surface flow is coming from around Hawaii. The western US will also be subject the reduced seasonal temperature fluctuates from its proximity to the Pacific. Once the area has cooled and equilibrated with the Pacific, temperatures will be stable. As the continental landmass would lose more energy and cool, the westerlies coming off the Pacific (now relatively warm) counteract this tendency. Conversely the east with mostly continental air flows experiences large seasonality and has a long-lasted source of very cold air from our neighbors to the north.

Summary

The west ceases to cool once it equilibrates with the Pacific, which looks like it happens early in winter (because even though the Pacific is cold, it isn't that cold). Westerlies from the ocean heep the west warm. East of the rockies there is no influence from large bodies of water and a constant source of cold arctic air and so the east continues to cool throughout the winter, until the pattern changes toward spring (and all the snow melts...).

For a smaller scale example of how water can have this influence, take a look at during the next extreme cold event in the midwest and great lakes, particularly when air is flowing westerly across Wisconsin and into Michigan. You will observe a large temperature gradient across Lake Michigan, which keeps Michigan warmer (sometimes much warmer) than Wisconsin. Later in the winter when the lake is frozen, that benefit is lost and so Michigan tends to be cooler later in winter as it is no longer "shielded" by the lakes.

Data

Data was downloaded from NOAA's North American Regional Reanalysis, accessed 17 Feb 2015. Files accessed include:
$\endgroup$
5
  • $\begingroup$ It might be more helpful to re-compute the composite for all of winter and calculate the above composites as anomalies of the full mean to see more of the subtlety in the changes during winter. Perhaps when I have more time.... $\endgroup$
    – casey
    Commented Feb 17, 2015 at 21:37
  • 2
    $\begingroup$ Great to see actual work written out as an answer. $\endgroup$
    – user1066
    Commented Feb 18, 2015 at 1:23
  • $\begingroup$ @casey i would suggest a panel plot if you want to show so many images of the same domain. Also in general less images would be nice. $\endgroup$
    – f.thorpe
    Commented Feb 18, 2015 at 3:30
  • $\begingroup$ @farrenthorpe Imagery is updated $\endgroup$
    – casey
    Commented Feb 18, 2015 at 18:22
  • $\begingroup$ @casey Great! Much more digestable now. $\endgroup$
    – f.thorpe
    Commented Feb 18, 2015 at 19:58
3
$\begingroup$

Climate is a very complex subject and really not my area of expertise but there are a couple of items to consider. You are only looking at a small subset of the northern hemisphere and you have to consider how the weather patterns change over the seasons.

You will note that on your map that the Western States show earlier colder periods. I suspect that this is primary influenced by the changes in the weather pattern developments over the Pacific ocean as winter approaches. The Pacific ocean temperature doesn't vary much over the year, as winter approaches the temperature difference between the air and the water is more pronounced. This leads to increasing stronger (deeper) low pressure cells over the Pacific. As winter progresses these storms continue to develop and pass over the continent effectively transferring more heat from the Pacific to the continent. As the temperature difference between the atmosphere and the ocean increases these winters storms become stronger. In the area I live in (Vancouver Island) December can often be cold because of Artic highs influencing our weather but once winter has been established we often have a lot of cloud cover, warm weather, and rain. Sometimes we get very warm weather from Hawaii, this is called the Pineapple Express http://en.wikipedia.org/wiki/Pineapple_Express.

In summary I suspect that the weather pattern you have observed is primarily driven by the changes in the weather patterns over the Pacific Ocean caused by the generally lowering of the atmospheric temperature in the Northern Hemisphere.

$\endgroup$
1
  • 2
    $\begingroup$ This answer would be strengthen with the inclusion of credible resources. $\endgroup$
    – user889
    Commented Jan 7, 2015 at 22:31

Your Answer

By clicking “Post Your Answer”, you agree to our terms of service and acknowledge you have read our privacy policy.

Not the answer you're looking for? Browse other questions tagged or ask your own question.