12
$\begingroup$

Some estimates claim that currently about one third of current human annual emissions of $\ce{CO2}$ are absorbed by the oceans. Some authors have calculated that about half of the global ocean total absorption occurs in the Southern Ocean. They also claim that:

the ocean $\ce{CO2}$ sink intensity has been weakening for several decades and has changed from a net sink to a net source since 2005

Considering the potential changes in ocean circulation and biological activity associated with climate change, can we expect the Southern Ocean to remain as such an important sink or are we moving toward a regime change that will lead to the ocean becoming a source of $\ce{CO2}$?

Carbon cycle

$\endgroup$
5
  • $\begingroup$ Could you clarify how far in the future or some emissions scenario? $\endgroup$
    – f.thorpe
    Commented Feb 7, 2015 at 2:56
  • 1
    $\begingroup$ I think that could and should be addressed in the answers, don't you think? $\endgroup$
    – arkaia
    Commented Feb 7, 2015 at 2:59
  • $\begingroup$ I have tweeted this fantastic question. $\endgroup$
    – user889
    Commented Feb 7, 2015 at 12:16
  • 2
    $\begingroup$ Wow, now I can claim I'm famous! $\endgroup$
    – arkaia
    Commented Feb 7, 2015 at 13:02
  • 1
    $\begingroup$ @aretxabaleta - theconversation.com/… Looks like you are right. Pure air of SH is no longer pure ? $\endgroup$
    – user1066
    Commented Mar 21, 2017 at 14:52

2 Answers 2

6
$\begingroup$

I think you may have misunderstood the abstract of the paper, which says:

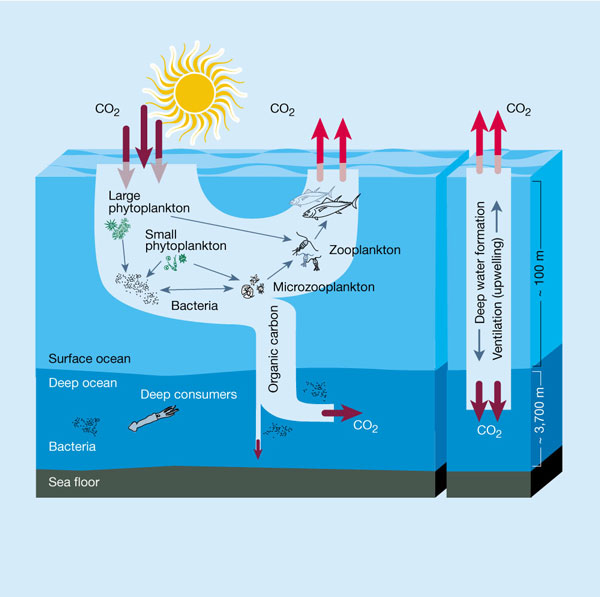
Various human activities, including fossil fuel combustion and forest clearing, emit about eight petagrams (or billion tons) of carbon in the form of CO2 into the atmosphere annually. The global ocean absorbs about two petagrams of CO2, and about a half of that amount is absorbed by the Southern Ocean south of 30°S, thus slowing the rapid accumulation of CO2 in the atmosphere. Partial pressure of CO2 (pCO2) is a measure of the chemical driving force for the CO2 exchange between the ocean and the atmosphere. This paper discusses its space and time distribution over the Southern Ocean. The major sink zone for atmospheric CO2 is located in a latitude belt between 30°S and 50°S, where the biological utilization of CO2 and cooling of warm subtropical waters flowing southward produce low seawater pCO2.

Note that most of the "half of the global ocean total absorption" occurs in a band between 30°S and 50°S.

Strong winds in this zone also enhance the ocean's uptake. Although the source-sink conditions vary over a wide range through the seasons in the areas south of 50°S, this zone is a small sink on an annual average. Winter observations show that surface water pCO2 values in the source region for Antarctic Intermediate Water have increased at a rate faster than the atmospheric increase rate, suggesting that the ocean CO2 sink intensity has been weakening for several decades and has changed from a net sink to a net source since 2005. The results of ocean general circulation-biogeochemistry model studies are found to be consistent with the observations.*

The "net sink to a net source since 2005" appears to relate to this area south of 50°S, which was only a small sink to begin with. This suggests that the southern ocean as a whole is still a strong carbon sink. As the evidence for an increase in the airborne fraction increasing is currently equivocal, this suggests that the natural carbon sinks (including the southern ocean) is still strengthening in response to increasing atmospheric concentrations.

Note the conclusion of the paper talks of the 30°S and 50°S being a sink in the present tense, which would be inappropriate if it had become a net source since 2005.
$\endgroup$
3
$\begingroup$

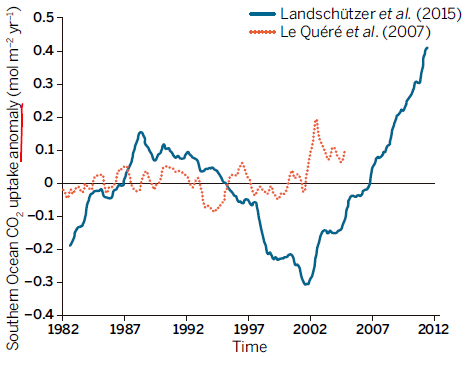
Some new evidence has come out, with the investigated are extending from 35S to 90S. Some things were different than in the study from 2007. The Southern Ocean played an important role in carbon sink. Compared to this domain, fishing activities are much in the low latitude.

enter image description here

Mikaloff-Fletcher, SE, 2015, Science

$\endgroup$
2
  • $\begingroup$ The graph provides interesting information about what has happened between 1982 & 2012, but without any discussion I don't see how it answers the question $\endgroup$
    – Fred
    Commented Dec 21, 2015 at 8:39
  • $\begingroup$ The paper discussing this graph makes no ideas about the future of whether Southern ocean will become carbon sink or sources for the unknown mechanisms lying on it. $\endgroup$
    – pring
    Commented Dec 21, 2015 at 8:46

Your Answer

By clicking “Post Your Answer”, you agree to our terms of service and acknowledge you have read our privacy policy.

Not the answer you're looking for? Browse other questions tagged or ask your own question.