16
$\begingroup$

The xkcd "Earth Temperature Timeline" depicts the global average temperature during the past 20,000 years, based on the known data. We already have a question about the chart's general accuracy, but I have a more specific question.

The chart says that multi-decade, multi-degree global climate shifts should be easily visible, and the fact that the chart is smooth and shows no such variances until it suddenly jumps in the past hundred years gives the graphic its visceral power.

But then, I found out about a myriad of known abrupt climate change events, such as the Younger Dryas 12,000 years ago, during which the temperature of large parts of the northern hemisphere decreased in temperature by 2 to 6 degrees Celsius over mere decades, then stayed that way for a millennium. Yet no rapid shifts like this are visible in the xkcd chart. This seems to imply that either

  1. the temperature shift in much of the northern hemisphere during the Younger Dryas was exactly counterbalanced by concurrent temperature shifts in the rest of the world so that the global average looks virtually the same; or
  2. the xkcd chart omits important details; or
  3. there are major contradictions in climate data from various sources.

Are one of these options correct, or is something else going on?
$\endgroup$

3 Answers 3

10
$\begingroup$

The apparent contradiction comes primarily from #1 but #2 also pays a small role here...

Temperature decreases during the Younger Dryas greater than $2^{\circ}$C are believed to have occurred almost exclusively above $30^{\circ}$N in latitude. The bulk of the tropics are thought to have been relatively stable during this time and the southern polar region showed slight warming. Additionally, global temperature averages are generally weighted by area and only one fourth of the earths surface lies between $30^{\circ}$N and the North Pole. All this combines to produce what is thought to be around 0.6$^{\circ}$C of global cooling at the start of the Younger Dryas (Carlson, 2013).

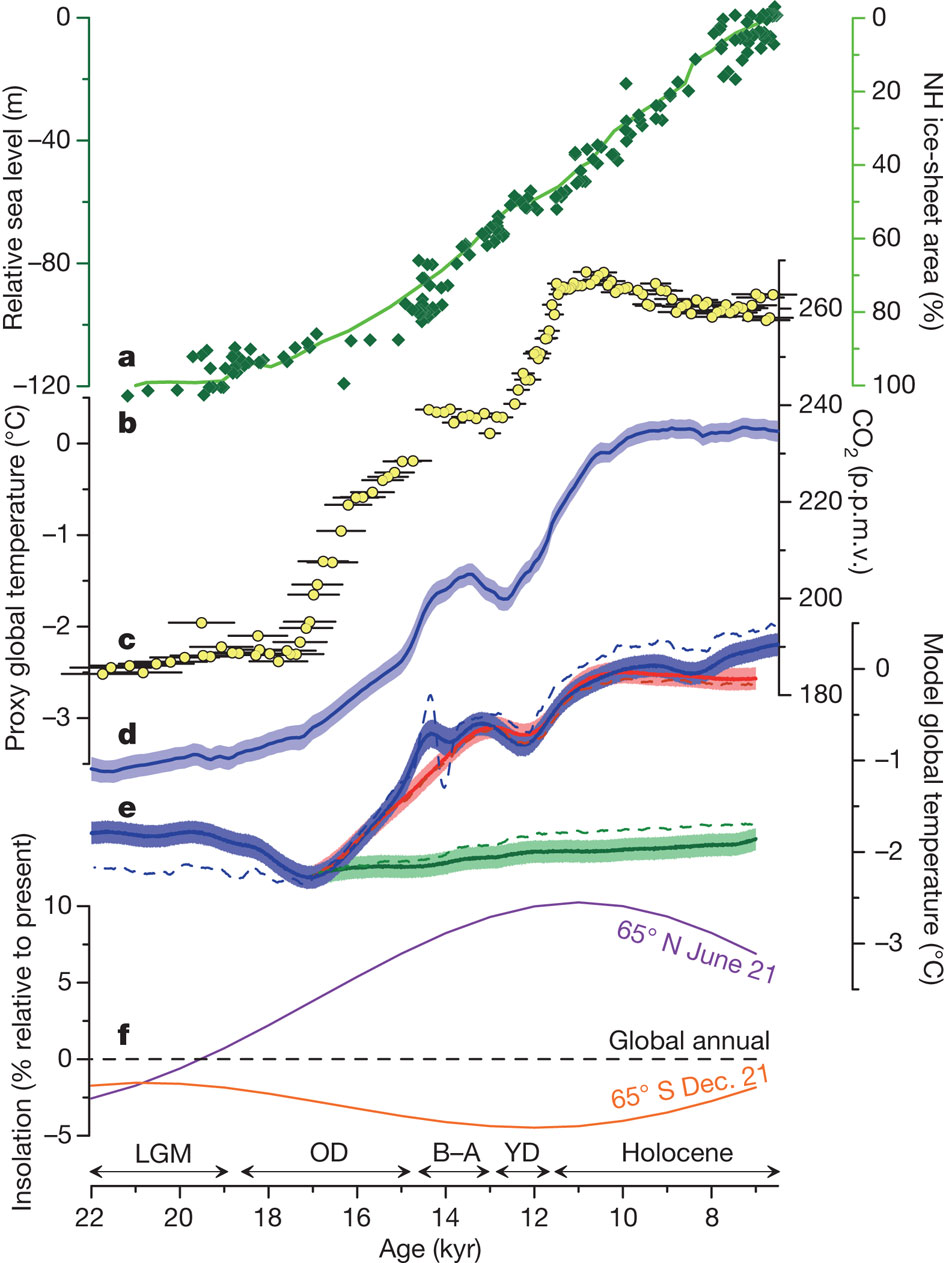
Randall does cite several sources in the top right of his graphic but Shakun et al. (2012) is the only one that presents meaningful temperature data during the Younger Dryas. And in fact, the comic's proxy data (dashed) temperature curve closely matches the temperature curve presented in this article over this period (curve d in the figure below).

Data from the Shakun et al. (2012) reference used by Randall

Interestingly, while Shakun et al. (2012) does show a global temperature decrease close to $0.6^{\circ}$C 12,000 years ago, the change doesn't appear to happen abruptly (at least not on the scale of decades). In the text of the paper the authors state that they built their temperature data set from 80 different proxy measurements taken over a wide range of locations. It turns out that these proxy measurements have a relatively long time resolution (a median value of about 200 years). That means that while the changes may have occurred very quickly this temperature curve is going to fail to capture that variability and appear "smoothed out". This does make the xkcd graphic a little misleading since the large temperature increase at the end is produced from data using a much finer time resolution, but this is a flaw common to all "hockey stick" temperature plots.

$\endgroup$
2
$\begingroup$

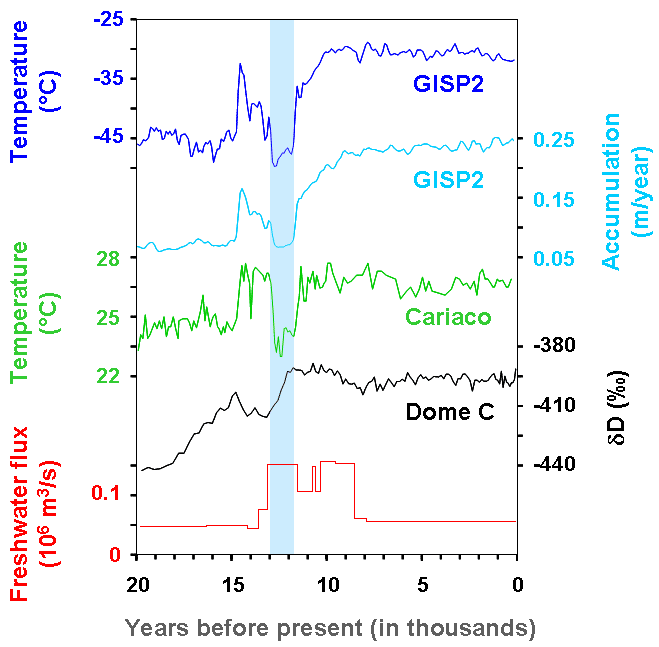
The best graphic I can find is a chart from NOAA covering various changes across the Younger Dryas:

enter image description here

GISP2 data is inferred from ice cores in Greenland, Cariaco is shallow sea temperature inferred from sea-shell deposits in Venezuela. The indication is an abrupt 10 C drop in temperatures in Greenland, and about 3 C in Venezuala. Note that these are two different sources (accumulation rates and Mg/Ca ratio in shells) of information, in two different places.

Corroborating evidence can be found with a 4 C drop in the British Isles from beetle species data in Isarin and Bohnecke, 1998 (Fig. 1); a 6.5-7.5 C drop in Switzerland from pollen analysis in Lotter, et al., 2000; a 3-4 C drop is sea surface temperature in the Shetlands-Faroe passage from marine sediment cores in Bakke, et al., 2009 (Fig 1, also not the big temp oscillations); again all different analysis methods and locations.

All in all, there is ample evidence that there were significant temperature drops in the Younger Dryas, and spiky ones at that, given the above graph. The xkcd graph, on the other hand, shows a slow drop in temperature of about a half a degree Celcius between ~11500 and ~10500 BC.

Where did xkcd get this data? I can't read the source for the references, Shakun, Marcott, or Annan, so I can't really say what the author was looking at (the HadCRUT4 data from IPCC, the last source, only goes back to 1850).

As a final commentary, I find this to be particularly frustrating. Normally xkcd should be considered a paragon of advancing science first thinking. Did xkcd cherry-pick the smoothest graph around to minimize the impact of 'natural' climate change and emphasize the anthropogenic? I don't know. But anthropogenic climate change is real and demonstrable, and doesn't need cartoonists to make pretty graphics that get shared all over the internet to encourage belief in it. Infact, a wise man once said that the universe doesn't care what you believe; science doesn't ask for your faith, it just asks for your eyes.

$\endgroup$
3
  • 4
    $\begingroup$ I object to your claim of Cherry picking. There is a problem in explaining science "en-mass" in that, when you explain variables of certainty and sigma levels, you progressively lose more and more of your audience. The Higgs boston is real is a story. The Higgs Boson is believed to be real within 5 sigma certainty, and only scientists care. What he presented was fair data backed up by honest studies. The worst you can say about his chart is that it's under-annotated, and it lacks representation from variation in studies, but it's not accurate to tie that to "belief" and not science. $\endgroup$
    – userLTK
    Commented Nov 18, 2016 at 3:05
  • $\begingroup$ @userLTK I guess I am conflating the science of the graphic a bit with my assumptions of the author's intent. So I will just say this as my complaint: I believe that the intent of this graphic is to convince people that that temperature increases (~1 C) over the last century are alarmingly large compared to historical, 'natural' changes. However, the literature I linked has evidence for larger temperature swings (3-10 C) in shorter time periods (as little as a decade) for individual locations on earth. Therefore, I think this graphic is misleading. $\endgroup$
    – kingledion
    Commented Nov 18, 2016 at 16:20
  • $\begingroup$ "But anthropogenic climate change is real and demonstrable, and doesn't need cartoonists to make pretty graphics that get shared all over the internet to encourage belief in it." - climate change doesn't need anything. But most people need (for example) politician that have belief at least sort-of-correlated with reality. In case of human-made climate change this is unfortunately frequently untrue what makes dealing with this problem more complicate. tl;dr Climate change doe's not care about human problems, people should care about their problems, especially big ones. $\endgroup$ Commented Dec 18, 2016 at 17:21
-1
$\begingroup$

"But anthropogenic climate change is real and demonstrable, and doesn't need cartoonists to make pretty graphics that get shared all over the internet to encourage belief in it."

But that is not the point in debate. That is the 97% (or even 100%) view. No-one disputes it. The subject of debate is, broadly, five factors: how much has the Earth warmed since the 1940s? How different is that from natural variability? How much of it is man-made through heat-trapping gases released by human activity (a subtly different matter)? How much warming is likely in the future? How much of a hazard will that future warming be?

None of these things are constrained very well at all. Only if all of them align as the most alarmist "scientists" say is there any reason at all to change our way of living in response to climate fears, and evidence suggests that is not the case. Even the IPCC suggests the effect will be measured as 0.2-2% reduction in world GDP by 2080, at a time when world GDP will be at least 300% of that we have today - so dropping that to "only" 194-199.4% rise from now to then.

Sound evidence suggests that one factor, poor siting of thermometers and temperature sensors, has exaggerated the temperature rise in the USA by up to 100%. The USA has one of the best systems of temperature measurement in the world. In many parts of the world the original data have been manipulated multiple times, almost always reducing old temperatures and increasing more recent ones; in Australia, for example, some analysis has suggested this is responsible for all the recorded warming. In Bolivia (I think it is) there is not a single thermometer in the system used for reporting world temperature.

So even the first part, the temperature rise, is not known to within a factor of 2.

Heck, there are problems even before that: multiple measurements in the 19th century, before regular measurements were made, showed CO2 levels higher than those years later, around today's levels; we are not even certain that the increase in CO2 is actually caused by human activity; the idea of "global temperature" is nonsensical, any knowledge of meteorology (I teach the subject) shows that a single number does not represent anything meaningful, literally it has no physical meaning, no place in the climate system. We are literally ignoring the existence of climate at the start of discussing climate change.

$\endgroup$

Your Answer

By clicking “Post Your Answer”, you agree to our terms of service and acknowledge you have read our privacy policy.

Not the answer you're looking for? Browse other questions tagged or ask your own question.