Great question!
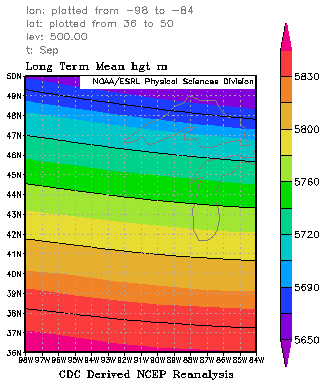
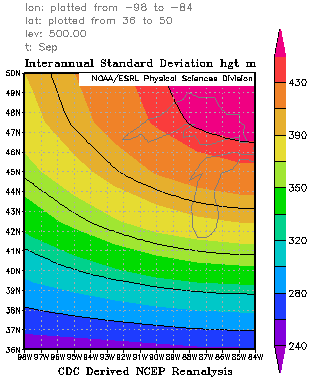
First, let's look at typical data: here are the 1981-2010 Reanalysis mean and standard deviation:


So looks like the mean 500 height in September for Wisconsin ranges from about 571-580 Dm, with a standard deviation of 36-42 Dm. These are mean pressures, not lows or highs, so already, not that far off your low. If (a big if) meteorological statistics are normally distributed, using this calculator, this would suggest a 560 Dm height would be in about the 29th-40th percentile, depending upon location. A little lower than usual, but apparently fairly typical.
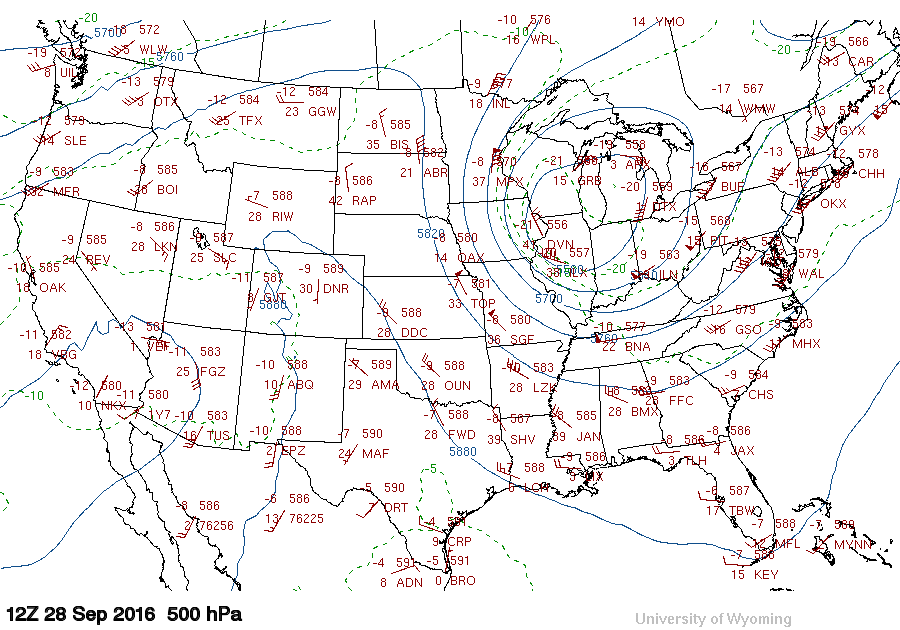
And just for good measure, looking back at the University of Wyoming, I was able to fairly quickly come upon:

A 554 or 555 Dm low. If you want to look for more images (perhaps even the event you are reading about), you could also look in the Pix directory for the dates of interest at Iowa State's MTArchive.
But it appears that 560 Dm would be a fairly typical height for a low/trough during early fall. Some people might still call it deep (30 Dm of contours on that plot from September would be fair), but it's nothing too abnormal.


