7
$\begingroup$

The BBC news article New Zealand quake: The geological impact of a 'complex' tremor says:

The powerful earthquakes which hit New Zealand were some of the most complex ever recorded, say scientists.

Most earthquakes are the result of rupture on a single fault plane. But the twin quakes led to the rupture of at least six faults, including a newly identified one at Waipapa Bay.

The article describes several resulting changes after the 7.8 magnitude 2016 Kaikoura earthquake, including seabeds raised above the surface, a dangerous 150m-high landslide dam has formed on the Hapuku River, and a town completely cut-off by landslides:

Kaikoura itself was completely cut off by landslides. About 1,000 tourists and locals have been evacuated by sea from the small town...

The image below is one of several from the article.

It's hard for me to understand what happened. It seems there were actually two distinct major earthquakes in rapid succession, and a lot of other motion and changes in nearby related faults. Was seismic data alone used to reach this conclusion, or is it a complex analysis of seismic, satellite, and ground-truth data used to "reconstruct" what actually happened? Is there some more technical description of the analysis available?
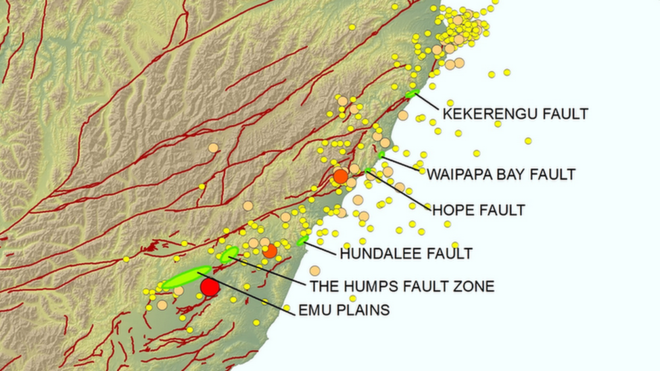
enter image description here

$\endgroup$
1

2 Answers 2

4
$\begingroup$

You need to see the InSAR data. E.g., see this image which is based on radar data acquired by ESA's Sentinel-1A satellite. For straight faults the pattern is not this complicated.

Using such observations we can estimate which parts of the fault slipped. E.g., take a look at these images. This is done by solving an "inverse problem", i.e., you have some observations and you're trying to estimate what parameters in a (physics-based) model can reproduce the observations. In essence, it is an optimization problem like curve fitting.

Note: Besides InSAR data, we can also use data from seismometers but the former makes it rather obvious.

$\endgroup$
1
  • 1
    $\begingroup$ OK I understand I think - the inverse problem is something like "what distribution of slipping along known faults would - when modeled - result in a distribution of topography changes that best matches those seen in satellite radar data?" So, without motion across multiple faults, the changes in ground height can't be matched with a given physics model. Excellent answer! You might add an explanatory link to InSAR, but this is exactly what I needed. Thanks! $\endgroup$
    – uhoh
    Commented Nov 22, 2016 at 12:01
1
$\begingroup$

The question re the sequence of events if not already satisfied is well illustrated on geonet showing the triggering of the individual recording stations

$\endgroup$
1
  • $\begingroup$ Thank you for this! I found this page so far but not sure of my way around the site. Is it possible to add a link or instructions to finding where the sequence is illustrated? info.geonet.org.nz/display/quake/2016/11/16/… $\endgroup$
    – uhoh
    Commented Dec 5, 2016 at 23:43

Your Answer

By clicking “Post Your Answer”, you agree to our terms of service and acknowledge you have read our privacy policy.

Not the answer you're looking for? Browse other questions tagged or ask your own question.