The link goes to the user Wikipedia profile. I added the graph and a link to the image in Wikipedia
Source Link

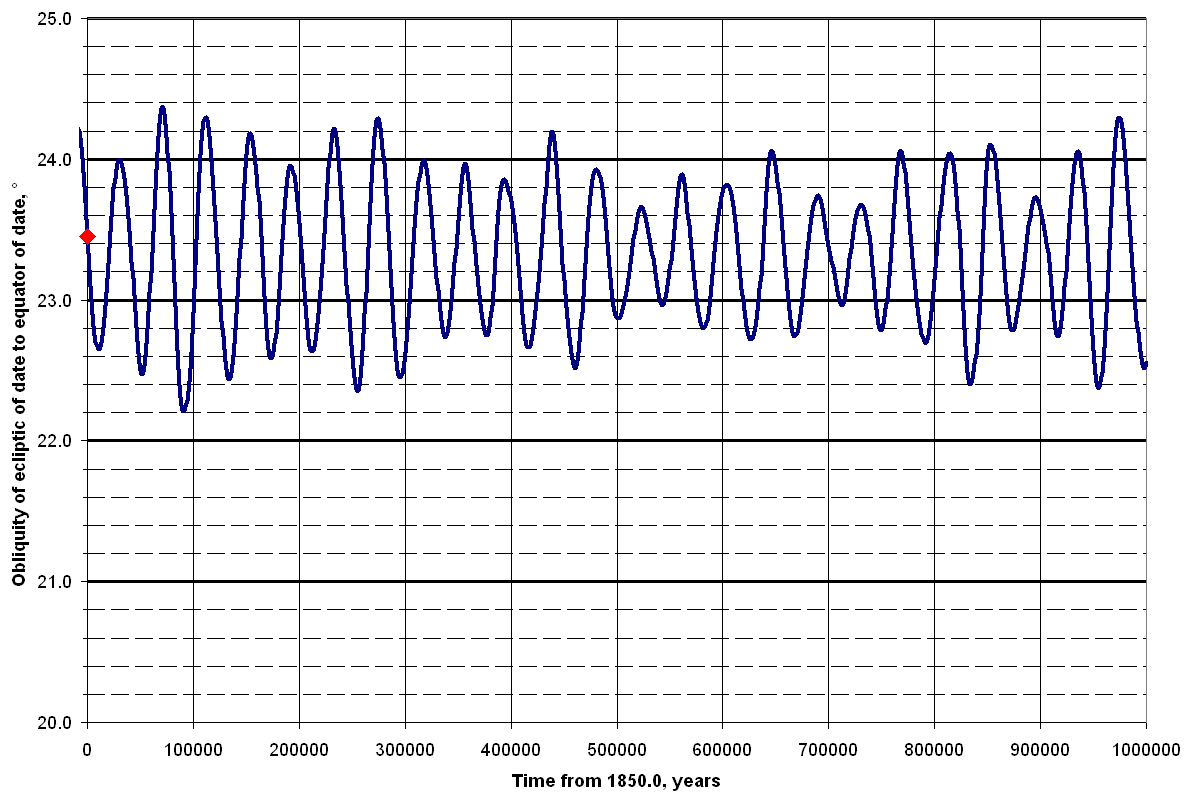
The Earth axis changes tilt with a period of 41 000 years, and with an amplitude of 1.2 degrees. What does the spectrum look like? Is it a steady periodic motion, or rather some quasi-periodic phenomenon?

To clarify, I want information about frequency content of plots like this one:

enter image description here

Source: https://en.wikipedia.org/wiki/User:Tfr000#/media/File:Obliquity_berger_-5000000_to_0.png-Wikipedia
The Earth axis changes tilt with a period of 41 000 years, and with an amplitude of 1.2 degrees. What does the spectrum look like? Is it a steady periodic motion, or rather some quasi-periodic phenomenon?

To clarify, I want information about frequency content of plots like https://en.wikipedia.org/wiki/User:Tfr000#/media/File:Obliquity_berger_-5000000_to_0.png-

The Earth axis changes tilt with a period of 41 000 years, and with an amplitude of 1.2 degrees. What does the spectrum look like? Is it a steady periodic motion, or rather some quasi-periodic phenomenon?

To clarify, I want information about frequency content of plots like this one:

enter image description here

Source: Wikipedia

Grammatical change
Source Link
Fred
  • 25.1k
  • 5
  • 52
  • 96

The earthEarth axis changes tilt with a period of 4100041 000 years, and with an amplitude of 1.2 degrees. What does the spectrum look like? Is it a steady periodic motion, or rather some quasi-periodic phenomenon?

To clarify, I want information about frequency content of plots like https://en.wikipedia.org/wiki/User:Tfr000#/media/File:Obliquity_berger_-5000000_to_0.png-

The earth axis changes tilt with a period of 41000 years, and with an amplitude of 1.2 degrees. What does the spectrum look like? Is it a steady periodic motion, or rather some quasi-periodic phenomenon?

To clarify, I want information about frequency content of plots like https://en.wikipedia.org/wiki/User:Tfr000#/media/File:Obliquity_berger_-5000000_to_0.png-

The Earth axis changes tilt with a period of 41 000 years, and with an amplitude of 1.2 degrees. What does the spectrum look like? Is it a steady periodic motion, or rather some quasi-periodic phenomenon?

To clarify, I want information about frequency content of plots like https://en.wikipedia.org/wiki/User:Tfr000#/media/File:Obliquity_berger_-5000000_to_0.png-

added 162 characters in body
Source Link
user877329
  • 321
  • 1
  • 6

The earth axis changes tilt with a period of 41000 years, and with an amplitude of 1.2 degrees. What does the spectrum look like? Is it a steady periodic motion, or rather some quasi-periodic phenomenon?

To clarify, I want information about frequency content of plots like https://en.wikipedia.org/wiki/User:Tfr000#/media/File:Obliquity_berger_-5000000_to_0.png-

The earth axis changes tilt with a period of 41000 years, and with an amplitude of 1.2 degrees. What does the spectrum look like? Is it a steady periodic motion, or rather some quasi-periodic phenomenon?

The earth axis changes tilt with a period of 41000 years, and with an amplitude of 1.2 degrees. What does the spectrum look like? Is it a steady periodic motion, or rather some quasi-periodic phenomenon?

To clarify, I want information about frequency content of plots like https://en.wikipedia.org/wiki/User:Tfr000#/media/File:Obliquity_berger_-5000000_to_0.png-

Source Link
user877329
  • 321
  • 1
  • 6
Loading