I've downloaded the all10g data from https://www.ngdc.noaa.gov/mgg/topo/gltiles.html
and also the globedocumentationmanual.pdf from the "The Globe Project Report" link on that page.
The only relevant format info I see there is on pages#82 (the 90th page) through 85.
Are there any other relevant pages in that manual I'm overlooking, or,
better yet, some other more comprehensive description of the data format elsewhere?
As far as pages#82-85 is concerned...
Firstly, the 16-bit little-endian stuff is no problem at all.
As best I can determine, the data is organized as follows:
   +--------------------------------------------+
   |   <-- 10800 cols for 90deg longitude -->   | ^
   |       = 30 arcsec per col resolution       | | 4800rows
   |                                      ^     | | for 40deg lat,
   |       and 4800/40 or 6000/50 is also |     | | or 6000 for 50
   |       = 30 arcsec per row resolution |     | v
   +--------------------------------------v-----+
Is this correct? Or are we talking about some other kind of projection (e.g., mercator) of the Earth's surface onto a plane rectangular grid? And am I correct in assuming that the 10800 longitude cols, even at high latitudes, is simply a waste of space (presumably for simplicity/consistency of format)?
Also, exactly how do you stitch the tiles together at their boundaries? For example, if you wanted to represent 0-to-90 degrees in one-degree intervals, you'd need 91 points, not 90, in order to cover both the 0 and the 90 boundary points. So the page#83 "Table 3. Tile Definitions", e.g.,
A10G min lat=50 max=90 min lon=-180 max=-90
presumably isn't covering both the 50 and 90 lat min/max boundary points. So which one? Or what, exactly?
Aside: while rummaging through the open data sites for elevation data, I also came across
https://lpdaac.usgs.gov/product_search/?keyword=Elevation&view=cards&sort=title
(then choose NASADEM_HGT v001), which seems to be in this pretty-widely-used netcdf (or variants like netcdf4) format, which I hadn't heard of before. Its format seems to be somewhat discussed at, e.g., https://www.researchgate.net/post/Extracting_data_from_a_netCDF_file (and several similar), but I haven't been able to google a nice, concise, meant-for-programmers discussion. Can you point me to one? Thanks.
E d i t
--------------
In response to @gerrit's reply below, I already looked over the netcdf format info, as best I could, and will maybe eventually study it more carefully. But that will clearly take lots more time (at least for me) than just dealing with the NOAA format, as discussed above.
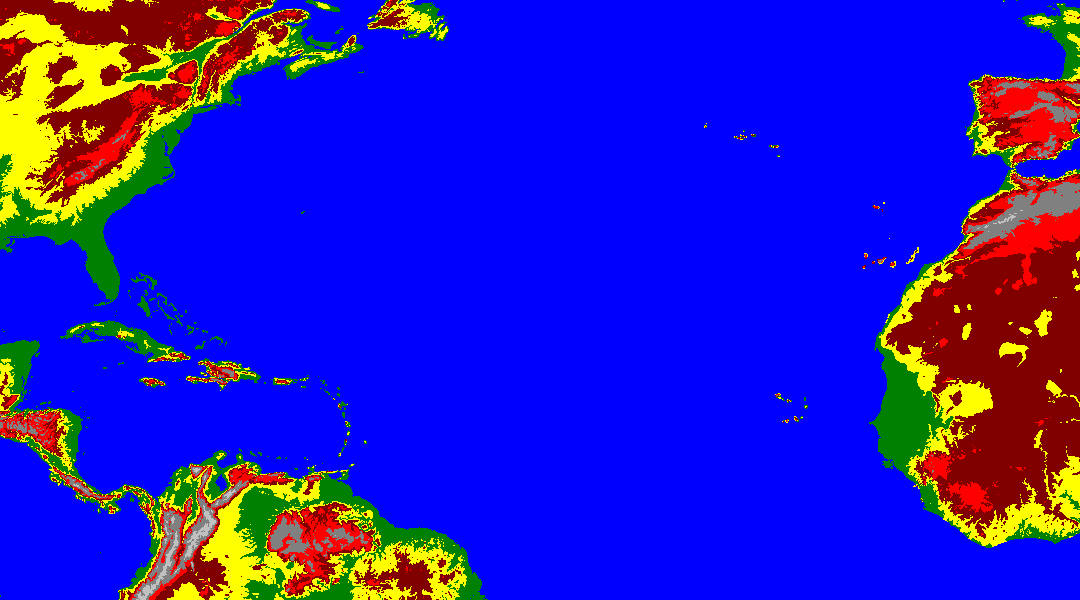
My programming is in C, and I've already pretty much dealt with that format, as illustrated by the gif below,
 created directly from the f10g file, just as a test.
The temporary test colors are
  /* --- colorkey --- */
  int colorkey[99] = {
          0*256 +  4,           /* sea surface and below is 4=blue */
        100*256 + 11,           /* up to 100m is 11=green */
        250*256 +  5,           /* up to 250m is yellow */
        500*256 + 10,           /*  500 maroon */
       1000*256 +  2,           /* 1000 red */
       2500*256 +  8,           /* 2500 gray */
      10000*256 +  9,           /* rest silver */
                  -1 };
The eventual goal, which really isn't that much more complicated,
is to generate a gif animation, where each successive frame shows
what happens when sea level rises, say, another foot.
In any case, a quick glance at the gif suggests that my naive interpretation of the data's lat,lon grid is, in all likelihood, generally more-or-less correct. And I probably don't need anything more accurate/precise for the intended purpose. But it would be nice (and I'd still like) to have more thorough documentation than what's cited above. Anybody have that info, or just a link to it would be great. Thanks.
E d i t # 2
------------------
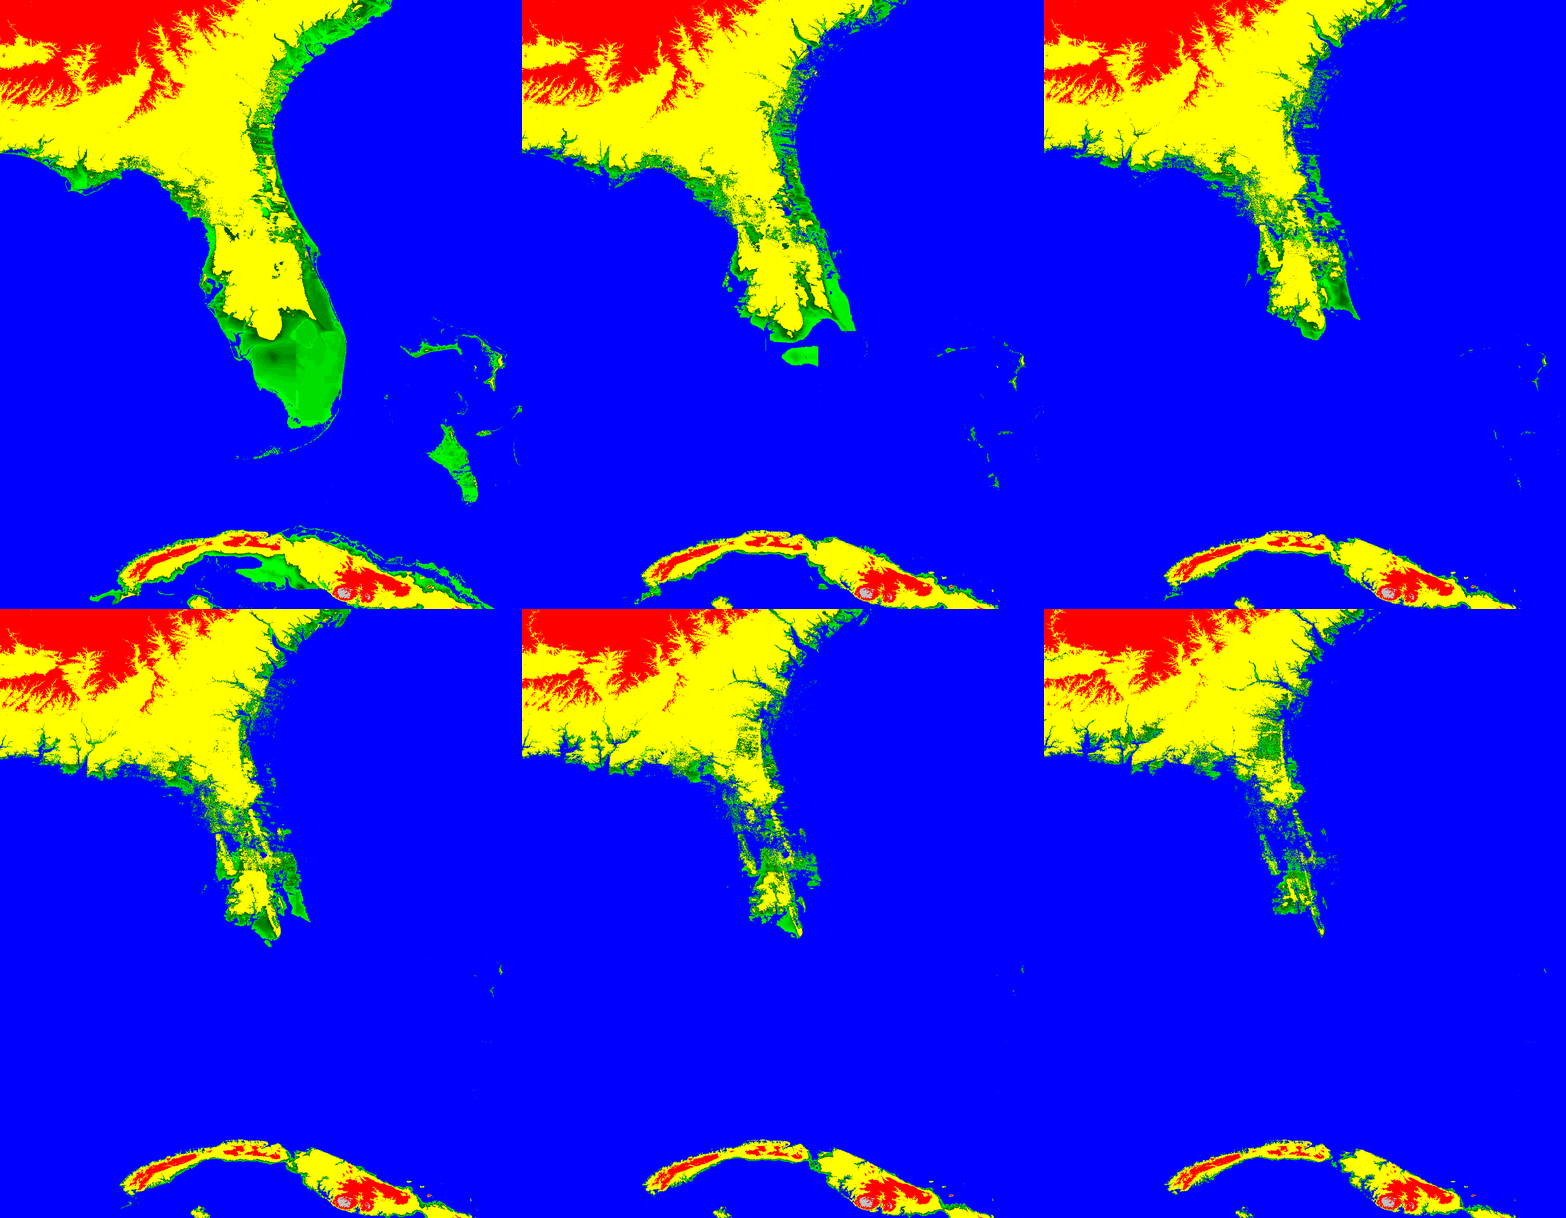
Just to illustrate the intended use, below's an animation, focusing on the Florida region of the f10g tile. Each successive frame raises sea level (actually, lowers the elevation of each land pixel, leaving ocean unchanged) by one meter. The first frame is raw data, and there are 30 frames in all, and then repeat. Of course, one meter times 30 is kind of extreme, but the NOAA data's in meters, so I don't immediately have any finer vertical resolution available. And it's just a prototype illustration (but I know where I'm buying my retirement home:).
 The colortable/colorkey is also different than the first gif above,
with light_green-->dark_green for the first twelve meters, and then yellow up to 100 meters, as follows
  int colorkey2[99] = {
          0*256 +  0,           /* sea surface and below is 0=blue */
          1*256 +  1,           /* 1-12 meters are shades of green */
          2*256 +  2,           /*  "  */
          3*256 +  3,           /*  "  */
          4*256 +  4,           /*  "  */
          5*256 +  5,           /*  "  */
          6*256 +  6,           /*  "  */
          7*256 +  7,           /*  "  */
          8*256 +  8,           /*  "  */
          9*256 +  9,           /*  "  */
         10*256 + 10,           /*  "  */
         11*256 + 11,           /*  "  */
         12*256 + 12,           /*  "  */
        100*256 + 13,           /*  yellow up to 100 meters */
        500*256 + 14,           /*  red 500 */
      99999*256 + 15,           /*  silver higher */