order of magnitude calculation
Source Link

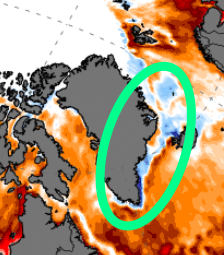
In theThe image below, cut from the Climate Reanalyzer, based on data from September 26, 2024, oneshows deviations of the sea surface temperatures from the long-term mean. The color code is intuitive, with orange resp. blue for warmer resp. colder temperatures.

One can see that the North Atlantic is much warmer than in past decades. However, the sea in a small strip around the South and East of Greenland is actually colder than it used to be. The adjacent warm Atlantic water shows an even warmer border region which looks like a shock front where a north facing current is stopped by the cold water:

A sea surface anomaly map showing a band of unusually cold water around Greenland's South and East

Is that cold water meltwater from Greenland's glaciers (at the end of September)? Apparently, Greenland's ice shield loses about 17 Gt of ice per year. Is that actually visible in simple temperature measurements? A quick back-of-the-envelope calculation shows that since a Gt is a cubic kilometer (don't you love metric units), 17 Gt would translate into a 1700 km long strip of a kilometer-wide layer of meltwater 10 meters deep (or 10 km wide and 1 m deep, etc.) Of course such a layer would not stay there imperturbed; this is just to check the order of magnitude.

Also, there is an interesting spot on Iceland's North where the "shock front" touches the coast. Have any unusual observations been made, e.g. weather events like unusual fog or precipitation, a change in the historical currents, or a (lack of) sea animal sightings?
In the image below from the Climate Reanalyzer, based on data from September 26, 2024, one can see that the North Atlantic is much warmer than in past decades. However, the sea in a small strip around the South and East of Greenland is actually colder than it used to be. The adjacent warm Atlantic water shows an even warmer border region which looks like a shock front where a north facing current is stopped by the cold water:

A sea surface anomaly map showing a band of unusually cold water around Greenland's South and East

Is that cold water meltwater from Greenland's glaciers (at the end of September)? Apparently, Greenland's ice shield loses about 17 Gt of ice per year. Is that actually visible in simple temperature measurements?

Also, there is an interesting spot on Iceland's North where the "shock front" touches the coast. Have any unusual observations been made, e.g. weather events like unusual fog or precipitation, a change in the historical currents, or a (lack of) sea animal sightings?

The image below, cut from the Climate Reanalyzer based on data from September 26, 2024, shows deviations of the sea surface temperatures from the long-term mean. The color code is intuitive, with orange resp. blue for warmer resp. colder temperatures.

One can see that the North Atlantic is much warmer than in past decades. However, the sea in a small strip around the South and East of Greenland is actually colder than it used to be. The adjacent warm Atlantic water shows an even warmer border region which looks like a shock front where a north facing current is stopped by the cold water:

A sea surface anomaly map showing a band of unusually cold water around Greenland's South and East

Is that cold water meltwater from Greenland's glaciers (at the end of September)? Apparently, Greenland's ice shield loses about 17 Gt of ice per year. Is that actually visible in simple temperature measurements? A quick back-of-the-envelope calculation shows that since a Gt is a cubic kilometer (don't you love metric units), 17 Gt would translate into a 1700 km long strip of a kilometer-wide layer of meltwater 10 meters deep (or 10 km wide and 1 m deep, etc.) Of course such a layer would not stay there imperturbed; this is just to check the order of magnitude.

Also, there is an interesting spot on Iceland's North where the "shock front" touches the coast. Have any unusual observations been made, e.g. weather events like unusual fog or precipitation, a change in the historical currents, or a (lack of) sea animal sightings?

Source Link

Is this cold water surrounding Greenland meltwater?

In the image below from the Climate Reanalyzer, based on data from September 26, 2024, one can see that the North Atlantic is much warmer than in past decades. However, the sea in a small strip around the South and East of Greenland is actually colder than it used to be. The adjacent warm Atlantic water shows an even warmer border region which looks like a shock front where a north facing current is stopped by the cold water:

A sea surface anomaly map showing a band of unusually cold water around Greenland's South and East

Is that cold water meltwater from Greenland's glaciers (at the end of September)? Apparently, Greenland's ice shield loses about 17 Gt of ice per year. Is that actually visible in simple temperature measurements?

Also, there is an interesting spot on Iceland's North where the "shock front" touches the coast. Have any unusual observations been made, e.g. weather events like unusual fog or precipitation, a change in the historical currents, or a (lack of) sea animal sightings?