11
$\begingroup$

It occurred to me that there might very will be a metric out there that measures and quantifies "daily brightness". Meaning, how bright any given day is, taking weather conditions and cloud coverage into account.

A general brightness metric is lumens, but I can't find anything on this subject with respect to meteorology.

And, if such a metric does exist, what's its range, 0 - 100? What weather/ambient conditions are represented at this range's extrema?
$\endgroup$

2 Answers 2

8
$\begingroup$

It can be measured in units of energy per surface area, for example, kWh/m2. The official SI name would be radiant exposure but I haven't seen that phrase used in a climate or weather context.

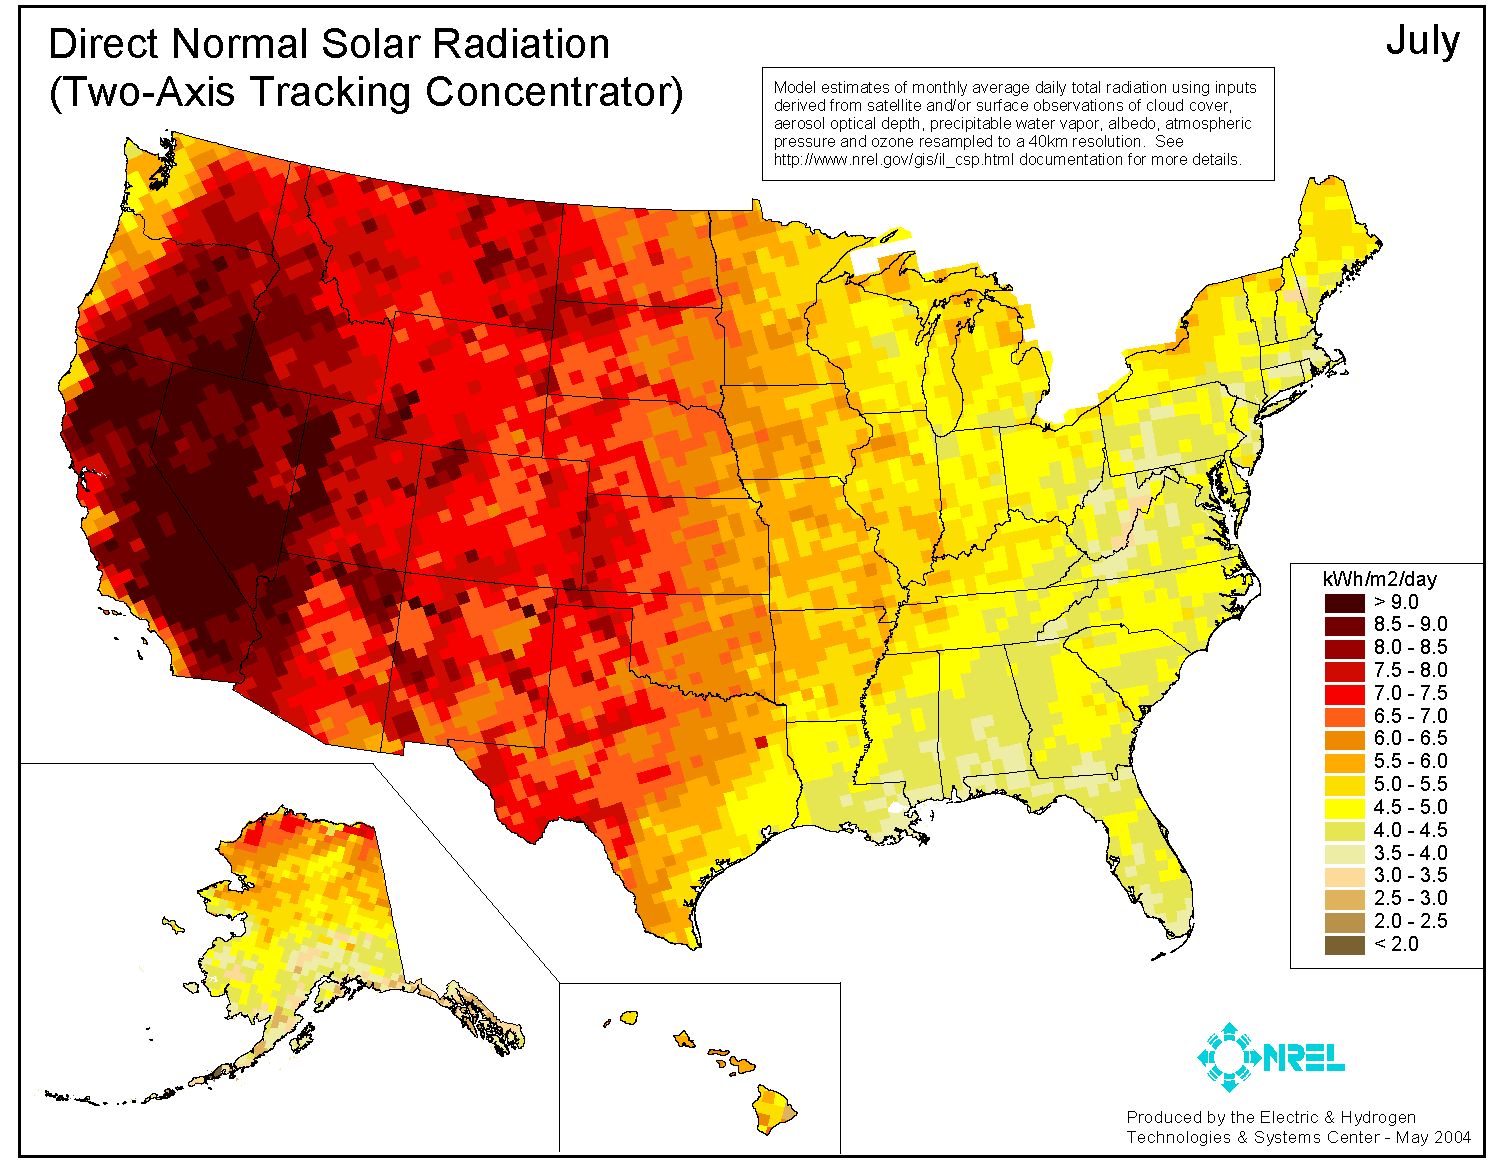
For example, here is a map by NREL of average radiation per day in the US for July:

NREL map of radiation in the USA
(Source: National Renewable Energy Laboratory)

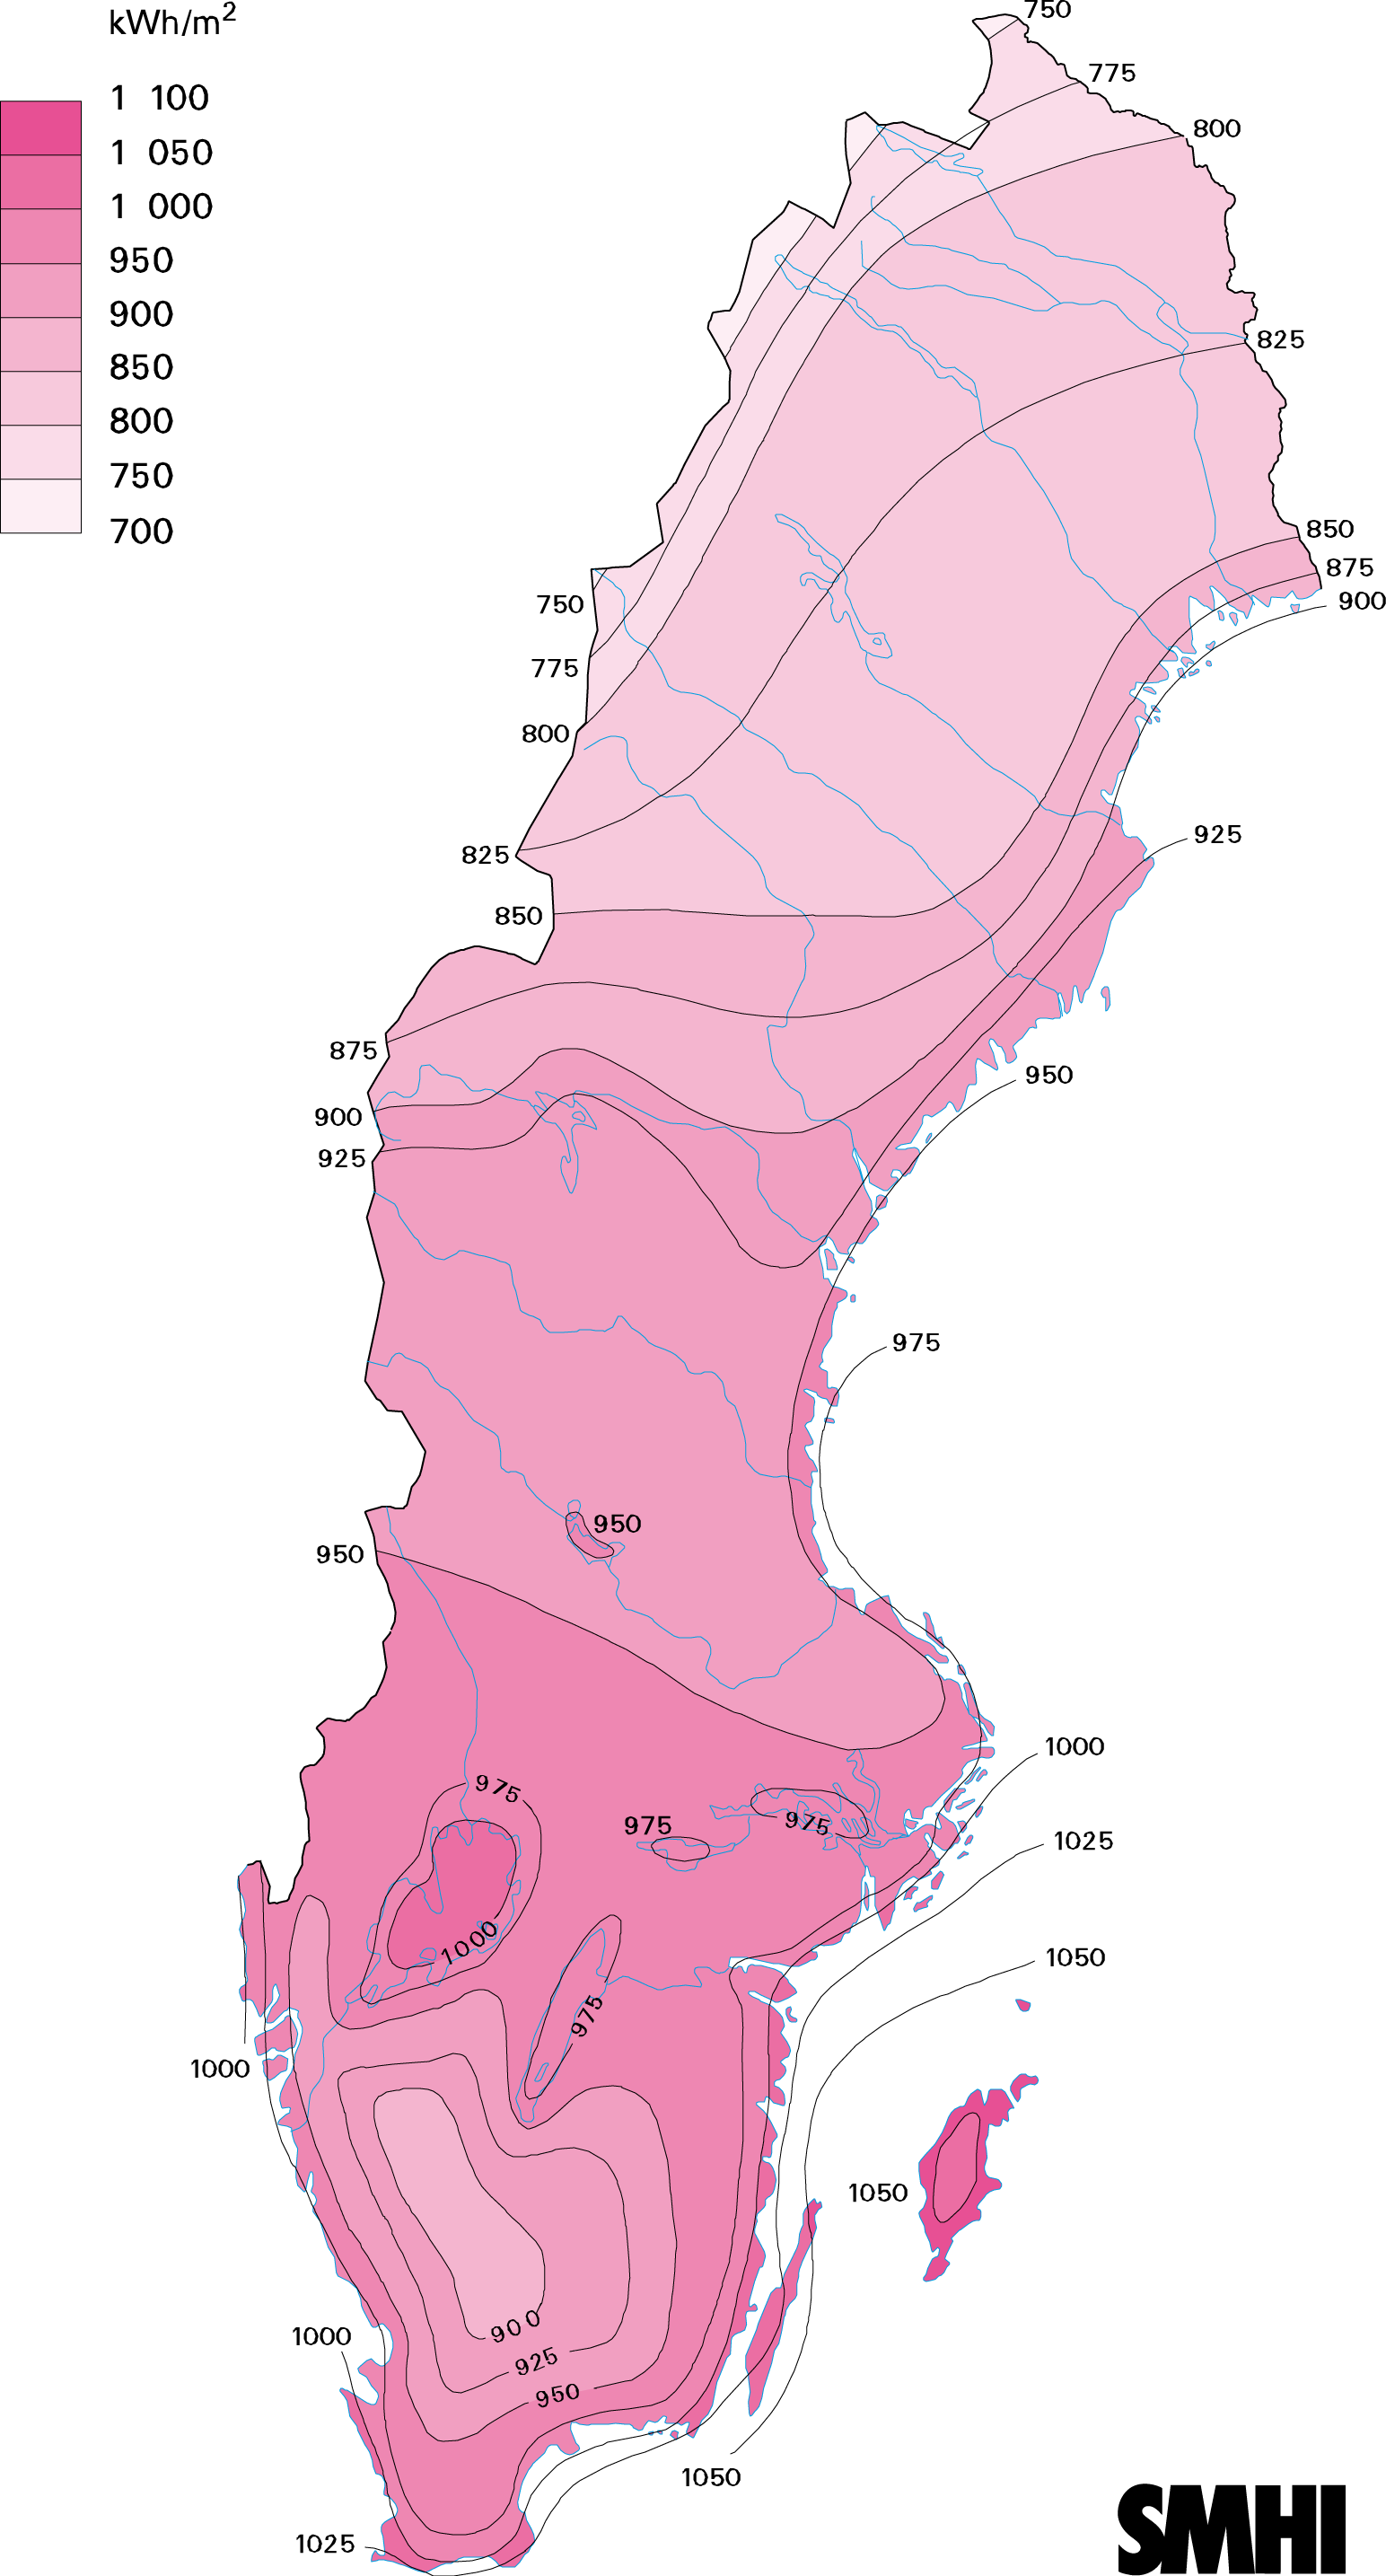
And here is a map for Sweden for the same quantity per year (hence the much larger numbers):

SMHI map of radiation in Sweden
(Source: SMHI)

$\endgroup$
6
  • 1
    $\begingroup$ Thanlks @gerrit (+1) - very interesting! So what's the name of this type of metric, is it just "solar radiation? Or something else? Also can I assume that 0 kwH/m^2 is pitch black (no radiation/light whatsoever)? Thanks again! $\endgroup$
    – smeeb
    Commented Jun 12, 2015 at 15:04
  • $\begingroup$ Also, the ranges/scales on that unit are way different between to the two maps you show. For the American one, the range is between 2 and 9. For the Swedish one, they are between 700 and 1,100! Any thoughts there? Thanks again so much! $\endgroup$
    – smeeb
    Commented Jun 12, 2015 at 15:06
  • $\begingroup$ @smeeb The name, to be honest, I'm not quite sure! It seems that it's technically Radiant exposure but I haven't heard that phrase used in an atmospheric context... $\endgroup$
    – gerrit
    Commented Jun 12, 2015 at 15:07
  • 1
    $\begingroup$ @smeeb just an aside, but "pitch black" means no photons in the visible wavelengths, but there may be energy in any other part of the spectrum. Solar irradiance works well as a proxy of brightness because peak solar emission is in the visible spectrum. $\endgroup$
    – casey
    Commented Jun 12, 2015 at 15:58
  • 1
    $\begingroup$ Pyranometers are the typical instrument for recording insolation [incoming solar radiation] that is integrated to make the figures above. A great place to see this data in action is the Oklahoma Mesonet, such as mesonet.org/index.php/weather/meteogram (bottom plot) Clouds will greatly reduce the values, but other times they will often be slightly below maximum values simply due to atmospheric composition, things like haze and pollution\stagnation, even temperature has some bearing. $\endgroup$ Commented Mar 3, 2017 at 2:55
4
$\begingroup$

In addition to radiant exposure, for certain locations, some meteorological services record hours of sunlight for periods during each day when the solar radiance equals or exceeds ${120\ \rm{W/m^2}}$. The weather observations for Sydney airport, for June 2015 can be seen here. Column 7 lists the sunlight hours for each day listed.

In terms of measuring data from the electromagnetic spectrum, ultraviolet radiation levels are measured, but not levels of light visible to the human eye.

In Australia, the Bureau of Meteorology measures the hours of sunshine each day but the Australian Radiation Protection and Nuclear Safety Authority measures and records ultraviolet radiation levels.

Real time measurements for 11 locations are posted on this site.

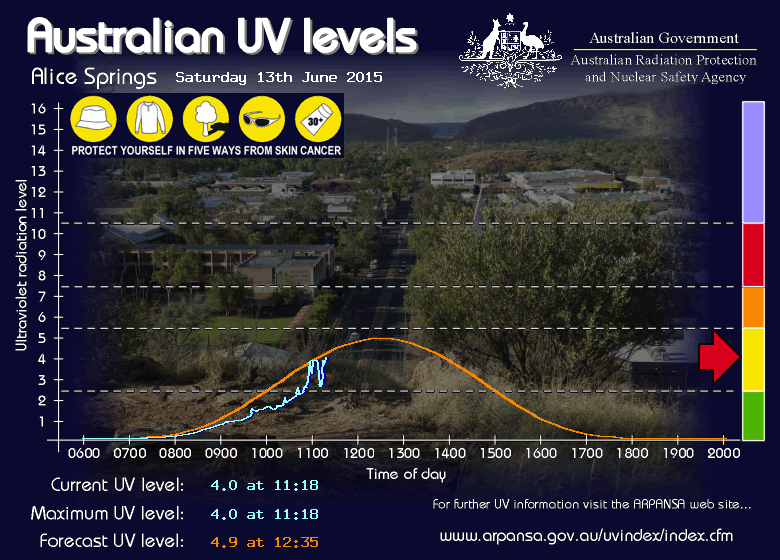
This is snap shot of the data for Alice Springs. The yellow/orange line is the forecast UV and the pale blue line shows the measurements.

enter image description here

$\endgroup$

Your Answer

By clicking “Post Your Answer”, you agree to our terms of service and acknowledge you have read our privacy policy.

Not the answer you're looking for? Browse other questions tagged or ask your own question.