7
$\begingroup$

Weather APIs often provide weather icons which symbolize the state of the sky at a given point, or as an average.

Is there a standardized way to define what the icon should be, based on quantifiable data such as cloud coverage or rain level (the idea being that, say, with over 50% cloud coverage a "cloud" is used, then with > 1 mm rain, "drops" are added etc.) -- or is it left purely as an interpretation to the user?

$\endgroup$
1
  • $\begingroup$ The answer is no. Selecting weather icons is purely subjective. $\endgroup$
    – Whir
    Commented Feb 10, 2022 at 7:03

2 Answers 2

7
$\begingroup$

Some historical standards formed due to instrumentation. Cloud cover observations were setup based upon okta, which are eighth fractions of the sky covered overhead during the past hour (perhaps 8 observations were taken/recorded by early instruments/observers). This lead to the United States National Weather Service using this table for reporting and forecasting:
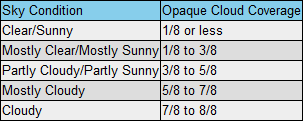
NWS

Likewise, the tipping bucket rain gauge measured in 0.01 inch (0.25 mm) increments, so that influenced how precipitation categories were chosen. This journal article states that:

In weather observations, drizzle is classified as (a) “very light”, comprised of scattered drops that do not completely wet an exposed surface, regardless of duration; (b) “light,” the rate of fall being from a trace to 0.25 mm per hour: (c) “moderate,” the rate of fall being 0.25-0.50 mm per hour:(d) “heavy” the rate of fall being more than 0.5 mm per hour. When the precipitation equals or exceeds 1mm per hour, all or part of the precipitation is usually rain; however, true drizzle falling as heavily as 1.25 mm per hour has been observed. By convention, drizzle drops are 0.5mm or less in diameter”

Showing that there is plenty of connection in the definitions of rain/drizzle intensities to the 0.25 mm baseline.

However, while many organizations may work from this framework, there's no reason other organizations must base their wording and icons on these historical criteria. They may wish to have more or fewer categories in their forecasts. For example, Wunderground's API table shows that [current link now access protected, original information here]:
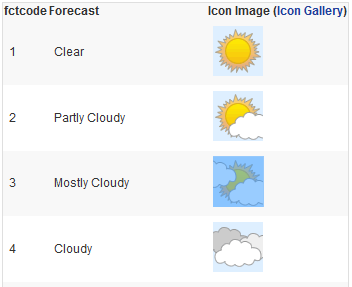
enter image description here

They use just four cloud coverage icon categories, while their forecast wording options include clear, cloudy, mostly cloudy, mostly sunny, partly cloudy, partly sunny, and scattered clouds. So they don't appear to match the standard NWS table.

So long story short: There are some historical standards, but sites can take liberties in reporting it how they wish. Looking through some of the APIs, it would definitely be nice if they would better indicate the actual criteria they use!

$\endgroup$
6
  • $\begingroup$ Nice answer! Do you think I should delete mine? $\endgroup$
    – f.thorpe
    Commented Jan 10, 2017 at 23:41
  • $\begingroup$ Funny enough, originally I wrote it as an edit to yours to include the extra information. But in the end, I felt I'd changed yours so much that it might make you unhappy that I'd altered your message :-) If you'd rather, I can add it back to yours and delete, as you found the Wunderground references that really were the heart of the idea. $\endgroup$ Commented Jan 10, 2017 at 23:47
  • 1
    $\begingroup$ Let's just leave them be for now I guess. Thanks for the insight. $\endgroup$
    – f.thorpe
    Commented Jan 10, 2017 at 23:50
  • $\begingroup$ No problem. Good answer yourself :-) The goal is to get good information out there, and I feel like we did a reasonable job. $\endgroup$ Commented Jan 10, 2017 at 23:50
  • $\begingroup$ The Weatherunderground link seems to be broken. $\endgroup$
    – user
    Commented Feb 9, 2022 at 14:07
7
$\begingroup$

The icons that are used are really just a visual way of describing the phrasing that is used in the forecast. You can see an example of one set of icons offered by Weather Underground here. And they have many different icon sets that you could choose from. The phrases themselves are linked to specific ranges of probability of precipitation, cloud cover, or other factor. This site shows some nice tables that give some of those ranges (sample shown below):

enter image description here

$\endgroup$

Your Answer

By clicking “Post Your Answer”, you agree to our terms of service and acknowledge you have read our privacy policy.

Not the answer you're looking for? Browse other questions tagged or ask your own question.