9
$\begingroup$

I'd like to have a rough idea of how large local surface CO2 concentration vary due to natural processes.

For example, a purely hypothetical experiment:

If I set up some CO2 monitors in a wide variety of locations around the globe (e.g. mid-ocean, jungle, desert, plains, tundra, mountaintop, beach...), say at 2 meters off the ground, and took some measures to avoid close proximity to substantial anthropogenic CO2 sources (industrial, transportation, population, farms) and fires or episodic geological sources (e.g. volcanos or magma pockets under lakes per @jamesqf), roughly speaking what might the variation look like?

A starting guess might be that they'd all be nearly featureless, around 400ppm, with only say +/- 10 or 20 ppm daily and yearly oscillations. Of course there is a whole lot of important science within those variations, but for the purposes of this question, I'd call those variations small.

Would my detector in a forest or jungle see higher peaks, or deeper troughs than one in a desert, or mid-ocean? What might the biggest excursions be? Might it ever reach down to 300 or up to 500 ppm due to natural processes?

The reason I'm asking is that while I tried to so some searches, it is very popular to show data from urban and suburban locations, where peaks of 500 or 600 ppm or even higher are seen that are attributed to wind direction and concentrated man-made sources, and that variation is not what I'm after. Here is just one example (48 hours and yearly) but there are many much larger studies published with sensors in urban areas.
$\endgroup$
2
  • 2
    $\begingroup$ If you include volcanic activity as a natural process, it can increase enough to be lethal. There's a lake in Africa - Lake Nyos: en.wikipedia.org/wiki/Lake_Nyos - which accumulates CO2 from underlying magma and suddenly releases it. $\endgroup$
    – jamesqf
    Commented Apr 18, 2017 at 19:45
  • $\begingroup$ @jamesqf yikes! I'll add "or other natural phenomena" to the appropriate sentence. Yes I believe I remember watching a documentary on TV about the Lake Nyos 1986 event, but that was quite a while ago. Thanks for the multiple reminders! $\endgroup$
    – uhoh
    Commented Apr 18, 2017 at 19:54

2 Answers 2

4
$\begingroup$

There are many studies quantifying temporal CO2 variability for a static location. Conducting such studies isn't particularly difficult, the cost of equipment is low, and it's an easy way to publish meaningful results. You may have a hard time wading through all of the publications to select the few that mean anything to you, specifically.

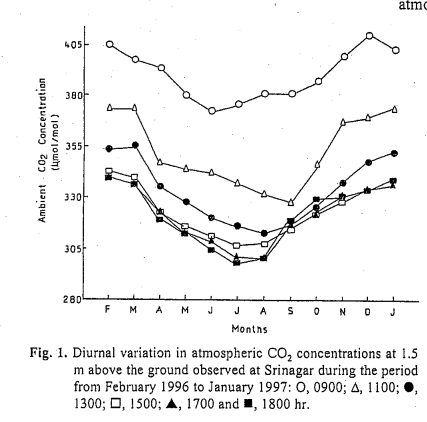
A quick 2 minute search found this paper (among a slew of others), entitled, Diurnal and Seasonal Variation of CO2 levels of surface air in Garwhal Himalaya in which this graph highlights daily CO2 variations over the course of a year, in mmol/mol. You'll have to look up the conversion to ppm CO2:

enter image description here

You may to search using these key words: CO2 variability, diurnal, yearly Seasonal and diurnal variations in moisture, heat and CO2 fluxes over a typical steppe prairie in Inner Mongolia, China

Temporal variations of atmospheric CO2 concentration in a temperate deciduous forest in central Japan

Seasonal and Diurnal CO2 Patterns at Diekirch, LU

Interannual variability in the atmospheric CO2 rectification over aboreal forest region

$\endgroup$
4
3
$\begingroup$

This is a good question because it prompts one to think about the many and varied natural sources of CO2 in the atmosphere. Of course your measuring apparatus will only show NET CO2, i.e. Sources-Sinks. So you need to think about CO2 sinks too. Start by making a list of all the possible sources and sinks. Then consider which apply in any given location for the apparatus. I would suggest that one of the main sources would be plant life so you will find quite a difference between an instrument in a tropical rainforest compared to a dry desert.

The ocean measurements will be interesting as oceans contain dissolved CO2 and it tends to come out as the temperature goes up. In reality a bit more complicated owing to exact surface exchange mechanisms, partial pressure of CO2 in the atmosphere , etc. You starting guess of +/- 10-20ppm looks low compared to my own guess. I would have said +/- 50-100 but it would indeed have been a guess like yours.

$\endgroup$
3
  • $\begingroup$ Thanks for your perspective. You are right, it seems I've stumbled upon something much more complex than I'd realized, which is making it a really fun exercise! $\endgroup$
    – uhoh
    Commented Apr 20, 2017 at 1:17
  • $\begingroup$ To measure the CO2 contribution from an individual source or sink would either have to be done by replicating some aspect of it in a lab experiment and then scaling it up / adjusting it to the real world OR constructing some apparatus in the real world around the source/sink (some kind of big box ?). So isolating accurate figures for various contributions is going to be difficult, error bars are going to be large. $\endgroup$
    – user7733
    Commented Apr 20, 2017 at 6:07
  • $\begingroup$ Luckily that doesn't stop us from thinking about them! I'm sure I've seen pictures of real 'big box' experiments somewhere, but not sure how the impact on temperature and humidity was accounted for. $\endgroup$
    – uhoh
    Commented Apr 20, 2017 at 6:15

Your Answer

By clicking “Post Your Answer”, you agree to our terms of service and acknowledge you have read our privacy policy.

Not the answer you're looking for? Browse other questions tagged or ask your own question.