How can I find the average number of days with thunderstorms for each month for different cities in the United States? I’m doing a researching project for this and I need to find some links that will show me the average number of days with thunderstorms for each month for different cities in the United States.
-
$\begingroup$ you might take a look here w2.weather.gov/jetstream/tstorms_intro it does not answer your question but it is a start. $\endgroup$– trond hansenCommented Jan 3, 2020 at 10:13
-
$\begingroup$ opendata.stackexchange.com/questions/10154/… may or may not be helpful $\endgroup$– user967Commented Jan 4, 2020 at 5:30
2 Answers
You should start with NOAA services. They have a Storm Events Database going back to 1950, where you can do queries for states/counties of interest. If you are more interested in lightning data, they also have some products, including raw data from a private company (you'll need access for this) and freely available derived products.
I too don't know any direct sources. So you will likely have to do a bit of legwork.
- Was going to offer that you could work a climatology together from monthly FP6 reports using the desired NWS site (click the office on https://sercc.com/nowdata.html, then switch to observed weather, then select CF6 and choose the site and then indicate the month report you want... on those reports any date with a 3 in the WX column had thunder... then you could sum them over many reports to make a climatology... time consuming, but I've done similar. It would be feasible to do a few sites, but brutal to do for many without automating the process)
But it looks like Iowa State's IEM ADP comes through with something a bit more robust and more reasonable in the amount of work it takes to finish together... Using option ADP #87 here, select the state/country of interest, then city you want data on (you may wish to further look into what the official observing site is for the city you want)... make sure you have thunder as the code choice, and select group by day of the years. Choose your years {you may want to skip the first and current year for better hopes of about equal data sets for each day of the year... you also may want to avoid going back too far in time, as it looks like records may have been less complete back towards the 1950s and earlier}, then make the plot with options. It'll produce a nice graphic which you may find useful. If you want precise numbers, you can reasonably make the true climatology by clicking download as Excel below the plot.
(If anyone reading happens to be a little unfamiliar with Excel {Open Office likely would work fairly similar?}... I can try to run you through the remaining process I used for this graphic:
select the day and year columns together,
then filter out duplicates,
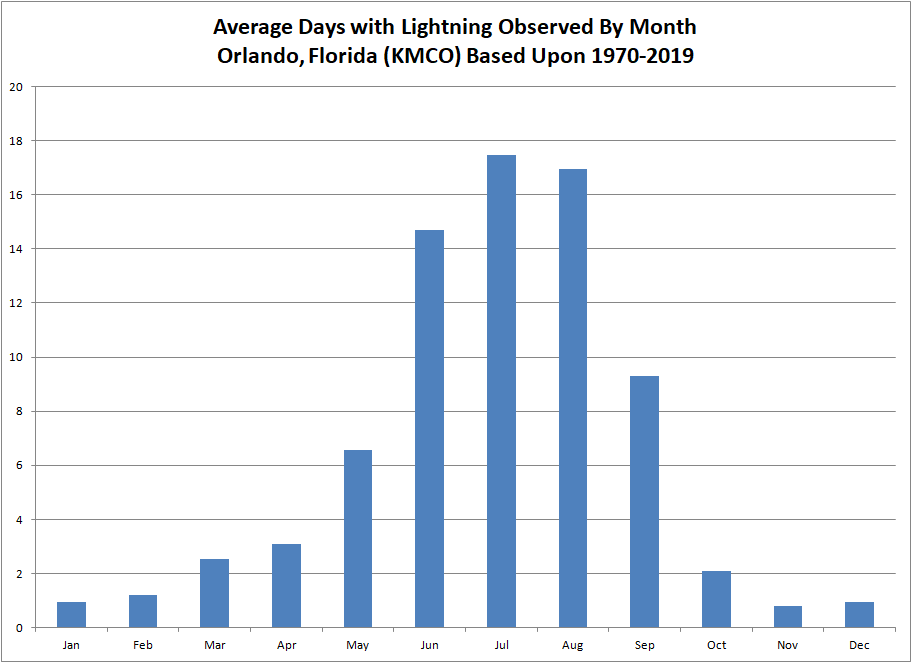
then make a Pivot Table in a new sheet with doy as Row Label and count of year as Σ values.After one mistake in reading, I realized you wanted monthly data... from here there may be easier ways to do the rest, but using my old Office 2007 and somewhat limited skill, I pushed through to get all dates summed by writing the formula
=ROW()-3
in cell D4 and
=IFERROR(GETPIVOTDATA("year",\$A$3,"doy",ROW()-3),0)
in cell E4.
Then expanded those cell formulas downward to row 369 (so 366 days were covered).
Then I typed the month names in F4-F15 and the formulas
=SUM(E4:E34)/50
=SUM(E35:E63)/50
=SUM(E64:E94)/50
=SUM(E95:E124)/50
=SUM(E125:E155)/50
=SUM(E156:E185)/50
=SUM(E186:E216)/50
=SUM(E217:E247)/50
=SUM(E248:E277)/50
=SUM(E278:E308)/50
=SUM(E309:E338)/50
=SUM(E339:E369)/50in G4-G15.
Select the F and G columns, add a bar graph from that, add a title, and I had:
It's certainly not readymade :-(
But it does at least seem a way you could possibly produce enough climatologies in reasonable time to get a rough idea of the country (or other parts of the world?)?
Hope you/others can find something that is already completed, but if not, hopefully this offers something a bit useful.
(Those looking to go all-out nuts and make a full dataset could download full ASOS data from Iowa State or NCDC and put together a detailed script to pull out the pieces needed. Feel free to share the data here if you do!)
