...measured in mol/m² within the total or tropospheric column. Is it possible to deduce concentrations for a specific slice of the troposphere?
Not really, since you have a crucial bit of information missing: the vertical distribution.
Your alternatives are:
- Combine satellite data with a model to estimate near-surface NO₂. The model may be able to estimate what surface conditions may be associated with what total column conditions, depending on other factors.
- Stick with total column data.
- Use a different data source, preferably ground-based measurements. Although a limb sounder does a much better job at getting a high vertical resolution (at expense of horizontal resolution), below 50 metre is too close to the surface.
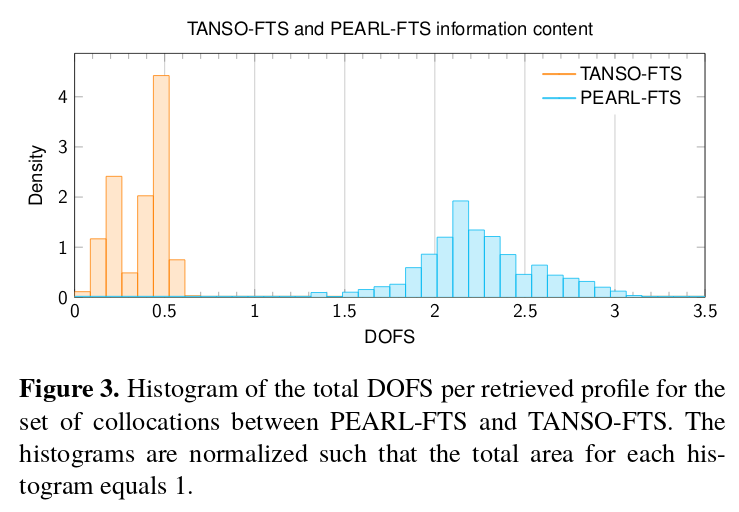
Measuring the vertical distribution with a down-looking sensor is difficult. You can get some information with vertical sounding by having many closely-spaced channels along a spectral line, but the vertical resolution is going to be very poor, in particular from space. Vertical sounding is common practice for temperature and water vapour, but if you search for NO₂ vertical sounding, you will find mostly, probably exclusively, ground-based measurements. I've tried to do CH₄ sounding and you're lucky if you can get 2 degrees of freedom of signal (DOFS), meaning a rough split in "lower half" or "upper half", but usually you get much less than that:

Source: Holl et al., (2016)
TANSO-FTS is a spectrometer carried on a satellite, PEARL-FTS is a ground-based instrument looking up. Now this was for CH₄ (not NO₂) and for a station in the Arctic at night. Hopefully you're not trying to do this in the Arctic and not at night, so if you try to retrieve profiles from a spectrometer (AIRS, IASI, CrIS) you can do a better job, but near-surface, probably not. Looking up, such as PEARL-FTS does, tends to be easier than looking down because you don't have a background surface to deal with.
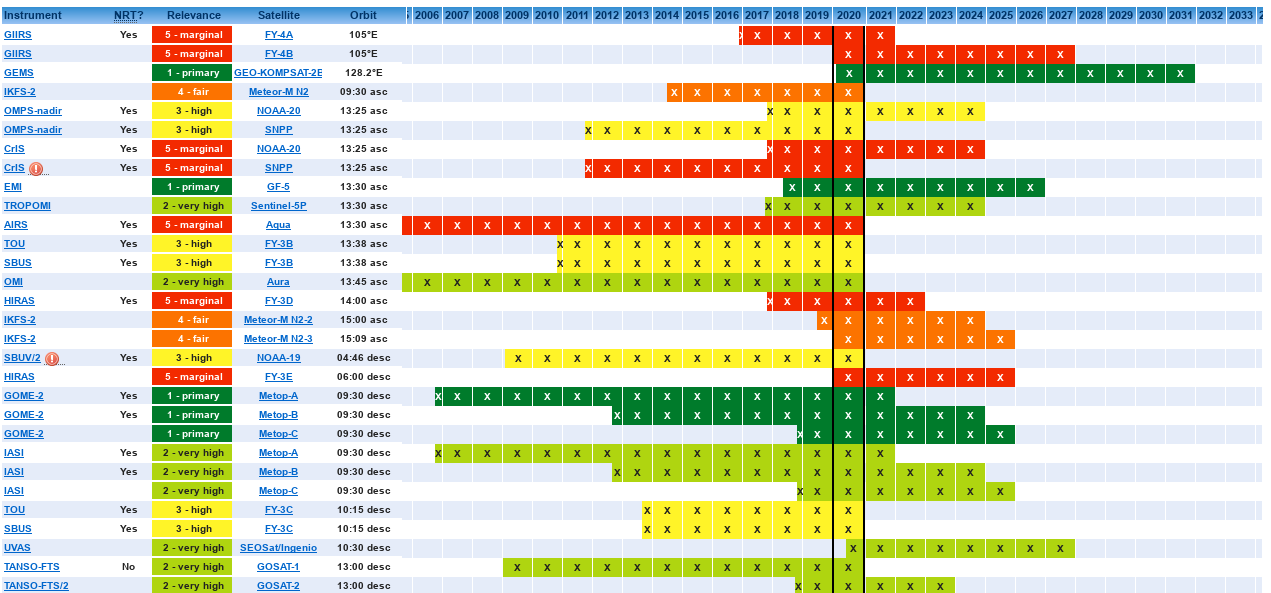
There are plenty of instruments that can retrieve NO₂ total column:

Source: WMO Oscar
However, to get a good quality profile from space you need a limb sounder, such as these:

Source: WMO Oscar
A limb sounder gets a much better vertical resolution, but a much worse horizontal and temporal resolution (there are no geostationary limb sounders, and the concept wouldn't make much sense). You can find a limb viewing geometry illustration here:

Source: Riese et al. (2014)
The best signal to noise ratio are from solar occultation limb sounders such as ACE-FTS, but those can only measure at sunrise and sunset. And close to the surface is difficult with any limb sounder, solar occultation or not, so it is unlikely that a limb sounder would even work in your case of measurements within 50 metre from the surface.
Depending on your scientific background, I would either look for model data or use ground-based measurements.
Holl, G., Walker, K. A., Conway, S., Saitoh, N., Boone, C. D., Strong, K., & Drummond, J. R. (2016). Methane cross-validation between three Fourier transform spectrometers: SCISAT ACE-FTS, GOSAT TANSO-FTS, and ground-based FTS measurements in the Canadian high Arctic. Atmospheric Measurement Techniques, 9(5), 1961-1980.
Riese, M. & Oelhaf, H. & Preusse, P. & Blank, Joerg & Ern, M. & Friedl-Vallon, Felix & Fischer, H. & Guggenmoser, Tobias & Höpfner, Michael & Hoor, Peter & Kaufmann, M. & Orphal, Johannes & Ploeger, Felix & Spang, Reinhold & Suminska-Ebersoldt, O. & Ungermann, Jörn & Vogel, B. & Woiwode, W.. (2014). Gimballed Limb Observer for Radiance Imaging of the Atmosphere (GLORIA) scientific objectives. Atmospheric Measurement Techniques. 7. 1915-1928. 10.5194/amt-7-1915-2014.


