First, yes, DM does appear to be decameters (though Dm would be more proper). D was actually the abbreviation I was taught for deca in grade school 20 years ago, but it appears da has become the official standard prefix now, perhaps because it was confused with deci (d). They also list the spelling deka instead of deca as well, perhaps for similar reasons (though that may well still vary by locale?)
Now, actually all typical plots aloft are the varying height values where a given pressure is found (850 mb, 500 mb, 200 mb, etc).
Why do we look at height variations on set pressure levels?
First, for background, it's important to realize that, by and large, pressure and height are proportional, such that either one can determine a strong approximation of the other. For large-scale weather you can directly invert them using forms of the hydrostatic equation.
$$\dfrac{\partial p}{\partial z} = -\rho g$$
Basically this proves extremely accurate when vertical acceleration is small, which is generally anywhere outside of intense thunderstorms. Even when it is less perfect, it's a pretty useful approximation for pressure variations important on the scale of synoptic weather.
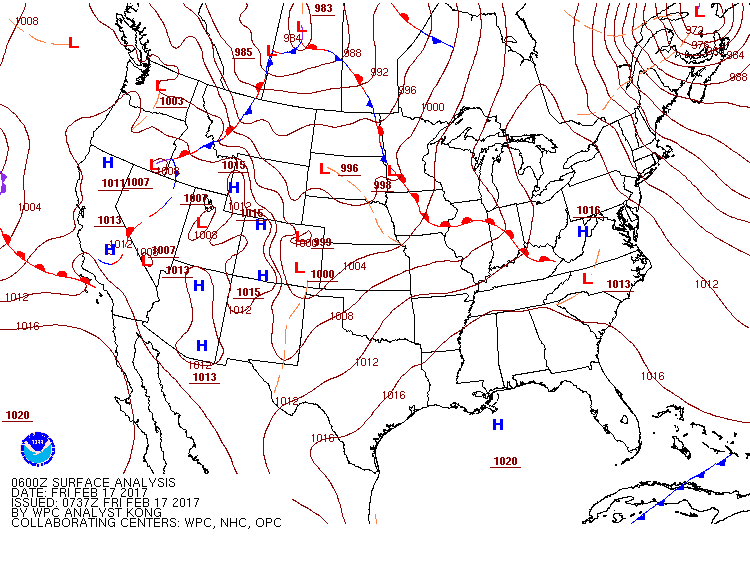
Actually, the basic weather pressure map we're used to RELIES upon this relationship... typical storm pressures we hear are 900-1000 mb, and maps often look like:
 But you'll find that pressure at the ground is lower in most locations than is indicated on such a map. This is because, despite being called "surface maps", they're actually sea-level pressure maps. At any station situated above sea-level a weather balloon cannot acquire that sea-level pressure. So the pressure must be extrapolated downward using these same equations.
But that still doesn't answer why we'd opt for isohypses...
One benefit may be that height maps are similar to topographic maps.
But it well truly stem from early meteorological rules of thumb. One important forecasting tool before advanced weather models came from the thickness equation (an application of the hydrostatic approximation). It works out that the thickness between 500 mb and 1000 mb was a helpful indication of what kind of precipitation would fall. Values lower than 5400 m indicate that the air column is probably cold enough for snow.
It seems quite feasible that this was relationship was noticed even before the equations were understood. 1000 mb is very close to the surface pressure in many of the big cities during the early development of meteorology (such as New York City, Boston, London, and Paris). So all they'd need to notice is a connection of the 500 mb height and the precipitation type. This might be easier than spotting a pattern of ratios of 5400 m pressure values to surface pressure values around 0.5.
In the end, it probably goes back to how early upper-air observations were recorded. It may well have been some guy going up in the balloons until radio, so would they have recorded at equal heights or equal pressures? Or when radio and the early instrumentation were developed, what would draw them to choose set pressures or set heights? I don't know the history well enough to give a certain answer to that.
In the modern era, models quite often use pressure coordinates (or similar sigma coordinates). In addition, if you wished to calculate the quasigeostrophic omega equation or apply the quasigeostrophic height tendency equation, perhaps equal pressure maps might be slightly more useful. However, I tend to doubt either of these are nearly significant in the overall development of the practice.
Also, why dekameters specifically?
A good contour interval at 500 mb proves to be 60 meters. With the precision of that final digit being so trivial, and with international communication being precious, they opted to just transmit the first three values. So 5400 meters just became 540, so dekameters.
Now, on the other hand, at 850 mb the reasonable contour was just 30 meters. (I believe for a long time, they opted to only send the last three digits of the height [as values are typically around 1200-1600 meters, the leading 1 is superfluous]. You can see reporting like this still on the University of Wyoming's website). At a 30 meter interval, that final digit is twice just a little more helpful to place contours. So meters were once used for 850 mb or 925 mb versus dekameters for 500 mb.
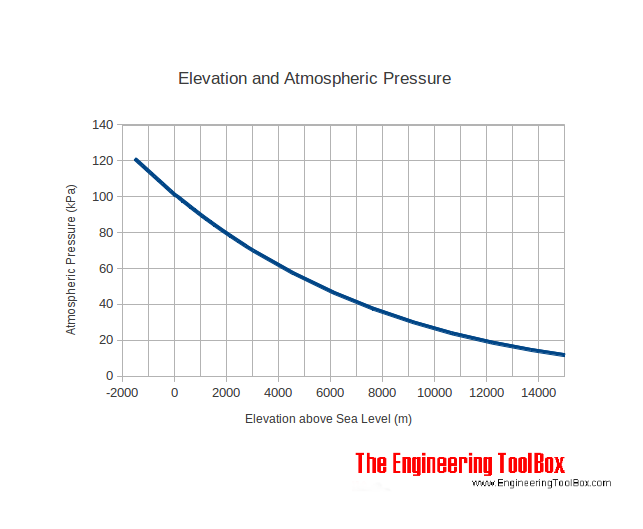
But, this has additional implications.... The reason these 850 mb heights fluctuate less than the 500 mb heights is because air density decreases with height. The same mass of air takes up more room at higher heights. So pressure changes more slowly as you rise:

But not only does this lead to different scales being important on different pressure levels... it could well answer that question of why they chose to record at equally spaced pressures instead of heights in early ballooning. Otherwise, they'd end up recording a ton of extra upper-level values which proved rather without value.
And why 500 mb values? The 500 mb map is a very central pressure level (near the level of
non-divergence). Low-level maps like 850 mb will have lows more connected in shape/position to surface lows than lows aloft [850 is often looked at more for thermal and moisture setup]. Upper-level maps like 200 and 300 mb won't have closed lows [and are looked at a lot for wind structure, in addition to short and long-wave trough positions]. So a central level like 500 mb proves to be a very good level to look at upper-level low strength.

