4
$\begingroup$

The effective temperature of the Earth is roughly 12 °F (- 11 °C), which means that in thermal equilibrium when it is emitting as much radiation as it is absorbing, the distribution of wavelengths and intensities of electromagnetic radiation an observer in outer space would measure would correspond to the temperature of a blackbody object at 12 °F (- 11 °C)

Of course, the surface of the Earth is actually much warmer than 12 °F (- 11 °C) due to the greenhouse effect. If there are greenhouse gases in an atmosphere then some fraction of infrared radiation from the terrestrial surface is absorbed by the atmosphere and re-emitted toward the ground. This re-emission of infrared radiation to the ground is like a trap for energy and over time it will cause the surface temperature of the planet to rise. This is right about where I have actual questions:

If the terrestrial surface is warming it will have to emit even more infrared radiation back to space. Is the atmosphere (and greenhouse gases) now absorbing the same fraction of a now larger amount of infrared radiation? in order to eventually rebalance incoming and outgoing radiation? I was thinking that the surface will grow warmer and emit more radiation until the amount exiting equals the amount incoming, establishing the new thermal equilibrium.

I often get confused because most diagrams for the Earth energy budget and net radiation balance show more infrared leaving the surface than is ever supplied by solar radiation at the top of the atmosphere in the first place. Is this because they count percentages or units of radiation twice? because some is re-emitted back?

I have included a photo showing how the electromagnetic wave types are partitioned in the radiation balance. It is from NASA's CERES page. As you can see, more infrared is leaving Earth than enters as solar radiation and yet this is still a picture of equilibrium where the net radiation is zero.

enter image description here

$\endgroup$
5
  • 1
    $\begingroup$ This isn't a full answer, but note that in this particular diagram there are only three fluxes that actually represent energy entering or leaving the planetary system: the incoming solar radiation, the reflected solar radiation, and the outgoing longwave radiation. 342 = 107+235 so it's in equilibrium. Everything else is exchange of energy between the surface and various layers of atmosphere. $\endgroup$ Commented Jun 6, 2019 at 19:50
  • $\begingroup$ @SemidiurnalSimon It's not perfectly in equilibrium though. After all, the Earth is warming up. $\endgroup$
    – gerrit
    Commented Feb 20, 2020 at 9:40
  • $\begingroup$ @gerrit true. I guess the diagram is wrong. $\endgroup$ Commented Feb 20, 2020 at 13:46
  • $\begingroup$ @SemidiurnalSimon Not wrong to the precision used — IIRC the imbalance is around (0.1±0.1) W/m², so when rounded to the nearest W/m² there is a balance still. $\endgroup$
    – gerrit
    Commented Feb 20, 2020 at 13:49
  • $\begingroup$ @gerrit ah! 1234 $\endgroup$ Commented Feb 20, 2020 at 14:00

2 Answers 2

5
$\begingroup$

I think you’re not far off with your understanding, but maybe I can put in a few comments to make things clearer.

I often get confused because most diagrams for the Earth energy budget and net radiation balance show more infrared leaving the surface than is ever supplied by solar radiation at the top of the atmosphere in the first place… As you can see, more infrared is leaving Earth than enters as solar radiation and yet this is still a picture of equilibrium where the net radiation is zero.

These types of diagrams only show the fluxes, but you have to remember that the surface (mainly the ocean) and the atmosphere are reservoirs of energy that have built up over time. In that diagram the top-of-atmosphere net radiation balance for the Earth system is,

67 (absorbed by atmosphere) + 168 (absorbed by surface) = 235 (outgoing longwave radiation)

and all the other much larger components are just different pathways for energy transfer between those two internal reservoirs. The sun only has to top-up the amount of energy that the reservoirs are leaking to space (235 W/m2) to maintain the equilibrium.

This re-emission of infrared radiation to the ground is like a trap for energy and over time it will cause the surface temperature of the planet to rise… If the terrestrial surface is warming it will have to emit even more infrared radiation back to space... I was thinking that the surface will grow warmer and emit more radiation until the amount exiting equals the amount incoming, establishing the new thermal equilibrium.

Broadly yes, but remember that the diagram you posted describes a long-term steady state (“thermal equilibrium”), so all that “warming” has already occurred and is built into those numbers. It may just be your phrasing, but note that surface doesn’t emit the bulk of its thermal radiation directly back to space. In your diagram this is the 40 W/m2 “atmospheric window”, which is much smaller than the 350 W/m2 of surface emission that’s absorbed by the atmosphere.

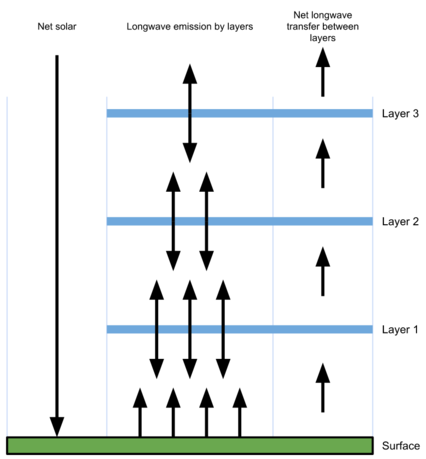
It might be better to think of the atmosphere less as trapping energy at the surface and more as slowing the net transfer of energy from the surface through the atmosphere to space. Atmospheric science text books often include a cartoon to demonstrate how energy is absorbed and re-emitted as it passes through the atmosphere:

enter image description here

Here each arrow is 1 arbitrary unit of energy. Things to note are that (1) each layer emits as much as it receives, (2) there's a lot more than 1 unit of flux within the atmosphere, (3) there's a steady 1 unit of net flux through the atmosphere and (4) this equilibrium is maintained by 1 unit in and 1 unit out at the top of atmosphere.

$\endgroup$
2
  • $\begingroup$ This is helpful and I actually really like the chart with the arrows you shared. I am grasping it conceptually much more. Also you cleared up the issue for me with the diagram I provided. In principle though, when the planet actually is disturbed from thermal equilibrium and begins to warm, is it because the same fraction of a larger amount of infrared is being absorbed? For example, say the atmosphere traps 20% of infrared. 20% of 1000 radiation units is larger than 20% of 100 radiation units. $\endgroup$
    – MattGeo
    Commented Jun 5, 2019 at 23:33
  • $\begingroup$ It depends where the perturbation comes from (i.e., net solar, surface, atmosphere). If it's a GHG increase then initially the atmos is absorbing a greater fraction of the same surface emission (the surface hasn't warmed yet). The input at the bottom is unchanged but the net flow through the atmos is slowed, so the output at the top is reduced (temporarily). In this cartoon equilibrium, increasing GHGs is like adding additional layers. $\endgroup$
    – Deditos
    Commented Jun 7, 2019 at 10:09
1
$\begingroup$

diagrams for the Earth energy budget and net radiation balance show more infrared leaving the surface than is ever supplied by solar radiation at the top of the atmosphere in the first place. Is this because they count percentages or units of radiation twice? because some is re-emitted back?

Consider the simpler case of a blackbody. The incoming radiation is mostly in the visible spectrum. This warms the body, which radiates mostly in the infrared. At equilibrium, the power leaving is the same as the power supplied, although at different wavelengths.

$\endgroup$

Your Answer

By clicking “Post Your Answer”, you agree to our terms of service and acknowledge you have read our privacy policy.