5
$\begingroup$

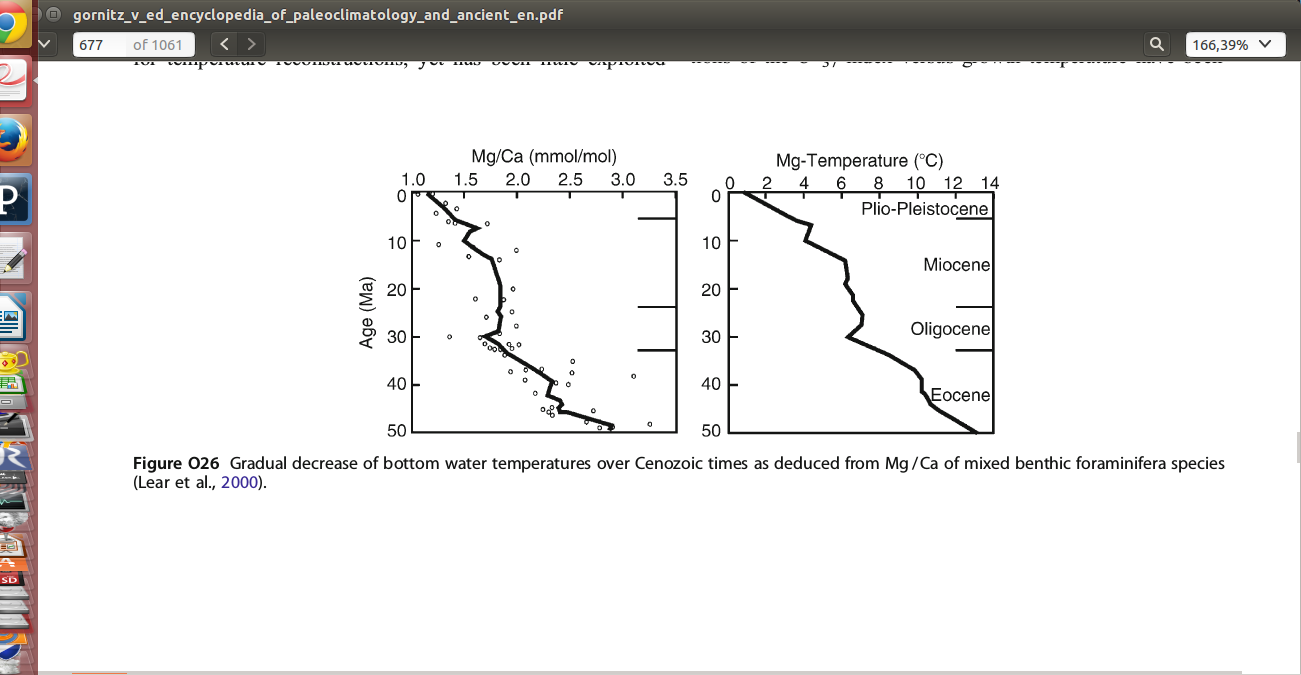
In The Encyclopedia of Paleoclimatology and Ancient Environments by Vivien Gornitz (2008, Springer) it is found that 50 My ago the sea temperature was about 13ºC above the present value.

Screenshot of charts.

AFAIK the several proxies gave consistent answers.

Why is the temperature always decreasing ?

$\endgroup$

2 Answers 2

7
$\begingroup$

I recommend you read the original paper Lear et al. (2000). In it they explain that the results are controlled by processes in polar regions and likely associated with the polar surface temperature. The surface temperature will vary considerable depending on the proximity and extend of the deep water formation areas. As these areas are fairly local, relatively small changes in the location and extend of deep water formation can result in deep water temperature being altered. The uncertainty associated with using single cores to estimate global temperatures is thus quite large. What the authors suggest is a predominantly ice-free world during most of the Paleocene and Cretaceous periods and several ice-sheet expansion events during the Oligocene, Miocene and Pleistocene. If there is no ice, the polar and sub-polar deep-water formation is limited and the water temperatures in the deeper part of the ocean is much warmer.

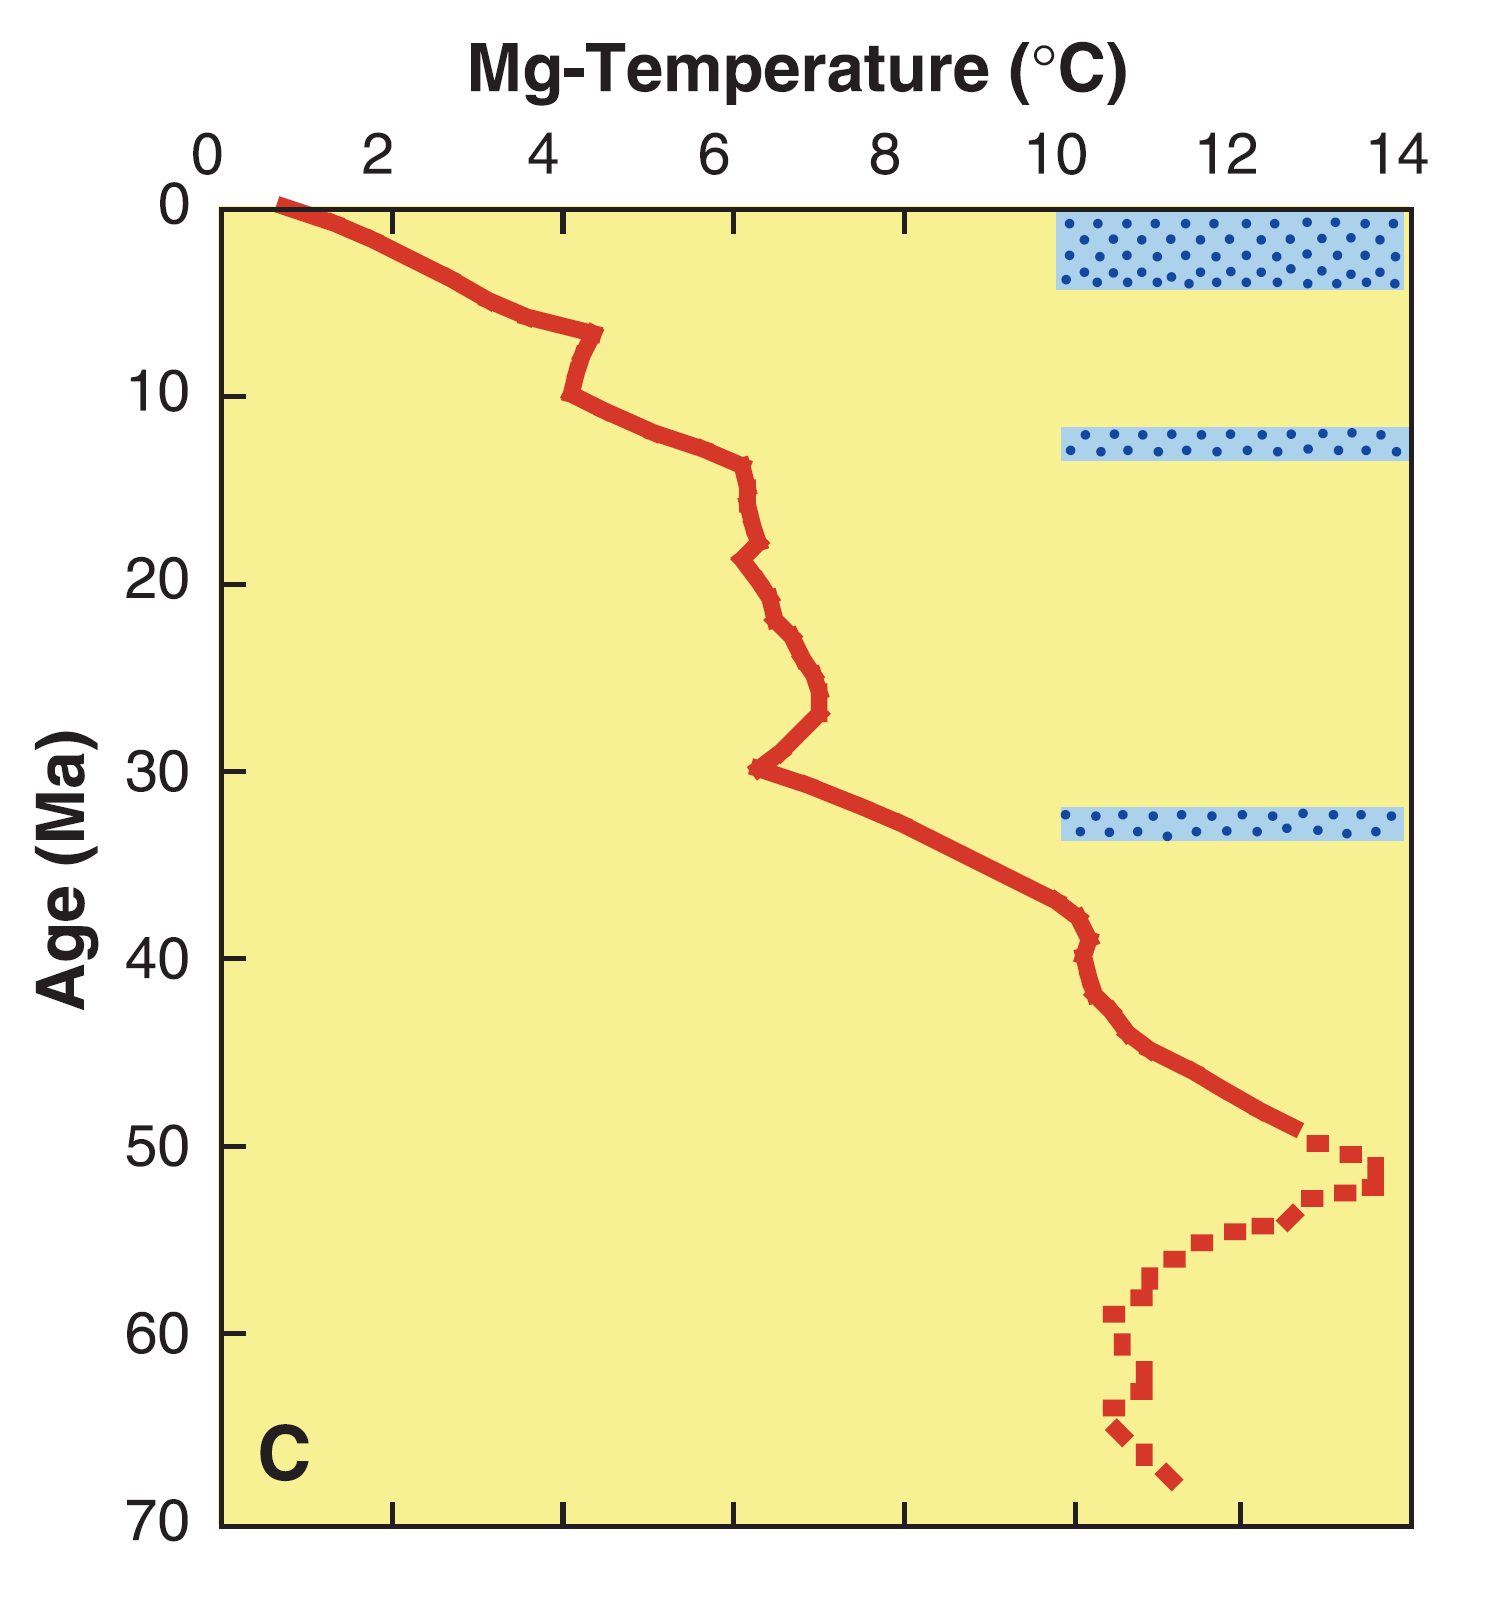
The temperature record shows a general cooling trend for the past 50 My, but its resolution is too low to define abrupt temperature extremes. Assuming that the process of deep water formation at high latitudes prevailed throughout the past 50 My, these deep-ocean temperatures can be inferred to represent polar surface temperatures (1). The temperature trend (Fig. 1C) appears to comprise four main cooling phases separated by periods of more stable temperatures. These cooling phases occur during the early Middle Eocene, the Late Eocene through Early Oligocene, the late Middle Miocene, and the Plio-Pleistocene.

Alternative evidence supports the existence of these principal cooling phases. A sharp cooling in the early Middle Eocene has been invoked to explain the abundance of siliceous sediments of this age (20). The Early Eocene warm climate is thought to have promoted in- tense chemical weathering of siliceous rocks at high latitudes, which resulted in high concentrations of dissolved silica in the oceans. The subsequent cooling stimulated upwelling of nutrient-rich water and intense biosilicification. The cooling over the Late Eocene through Ear- ly Oligocene is coincident with the transition from “Paleogene” to “transitional” benthic foraminiferal faunas and high extinction rates in planktonic and terrestrial faunas. The initiation of this deep water cooling also coincides with a reduction in the extent of tropical rainforests on land (21, 22). The cooling in the late Middle Miocene is marked by a narrowing of tropical and warm subtropical biotic provinces in terrestrial and marine environments (23). Warmwater diatom assemblages were replaced by cold-water species at this time (24). The Plio-Pleistocene cooling is not represented by an extinction phase in benthic foraminiferal faunas; instead, faunal groups adapted to the changing bottom water conditions by migration (21).

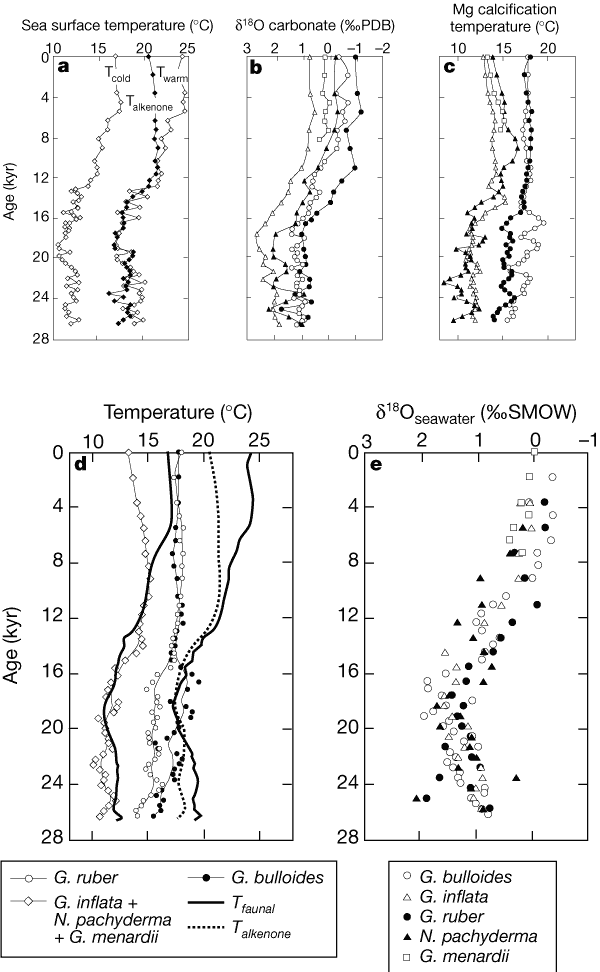
When you use data from other regions, you get a much different result. For instance, Elderfield & Ganssen (2000) showed how different the temperature changes can be for different species and locations. Elderfield Nature paper

Their data are much more recent and suggest an increase in temperature over the last 20,000 years. As always, everything depends on the temporal scales. One issue that tends to be true is that estimates for periods long time ago tend to have larger uncertainties.

$\endgroup$
3
  • $\begingroup$ The encyclopedia mentioned it to be ocean wide "... Lear et al. (2000). They suggested an ocean-wide gradual decrease in deep-water temperature of 12 C over Cenozoic times..." (Figure O26). The abstract reads "A deep-sea temperature record for the past 50 million years has been produced...The record is strikingly similar in form to the corresponding benthic oxygen isotope (d18O) record and defines an overall cooling of about 12°C in the deep oceans with four main cooling periods..." Why you think "results are local to the polar regions"? $\endgroup$ Commented Sep 16, 2015 at 0:54
  • $\begingroup$ continuation... data is not local to high latitudes as seen in Table 1. Locations of deep-sea sites ...(thanks for the link) $\endgroup$ Commented Sep 16, 2015 at 0:56
  • $\begingroup$ @HelderVelez Thanks for the pointer. I changed the answer accordingly and explain better what I meant. I hope this clarifies the issues $\endgroup$
    – arkaia
    Commented Sep 16, 2015 at 1:17
3
$\begingroup$

The reference in the figure (where the plot was cropped from - the period 70M-50M years is missing) is helpful.

The resolution on that plot is quite low but it can be seen that, for the past 50M years, the temperature is not always decreasing. There appear to be four main cooling trends flanked by periods of constant or increasing temperatures.

According to the authors, the long-term cooling trend is a result of several processes that work together in a nonlinear way to modify the distribution of heat on the surface of the Earth. However, we require many more global records of temperature before we are able to quantify their respective contributions.

From the paper:

The long-term cooling over this period is thought to have resulted from a combination of factors that altered the amount and distribution of heat over Earth’s surface. Variations in atmospheric greenhouse gases (principally CO2), Earth’s albedo, and linked changes in ocean-atmosphere circulation patterns, which are also influenced by the opening and closing of ocean gateways, could contribute to this long-term cooling.

Lear, Caroline Helen, H. Elderfield, and P. A. Wilson. "Cenozoic deep-sea temperatures and global ice volumes from Mg/Ca in benthic foraminiferal calcite." science 287.5451 (2000): 269-272.

Actual figure from the original paper:
enter image description here

$\endgroup$
1
  • $\begingroup$ The motivation : "The long-term ***** over this... could contribute to this long-term *****". Those arguments can be used to justify the opposite conclusion ". It is unlikely that the arguments are valid to explain the downtrend along all the past Earth's history as show by the $\delta^{18}O$ in the Fig 2 of Jaffrés(2007) review $\endgroup$ Commented Sep 16, 2015 at 0:15

Your Answer

By clicking “Post Your Answer”, you agree to our terms of service and acknowledge you have read our privacy policy.

Not the answer you're looking for? Browse other questions tagged or ask your own question.