4
$\begingroup$

I have been trying to find data of sea temperatures in the deep sea (>1000 m), but I still haven't found any scientific papers. I have only seen websites talking about the temperatures, but without providing evidence.

So what's the evidence for very low (<10°C) temperatures in the deep sea and what were the methods used to obtain this evidence?

I know about the websites like https://www.nodc.noaa.gov/cgi-bin/OC5/SELECT/woaselect.pl where I can check the temperature, I'm foremost asking for the methodology.

$\endgroup$
1

3 Answers 3

3
$\begingroup$

General Information

One major operational system for the measurement of deep sea temperature, salinity and pressure is the Argo program. Individual Argo floats are distributed in the worlds oceans. Their measurement data are scientifically evaluated and are available for public download. Additionally, several research institutions own gliders. However, I am not sure if they are also used operational for deep sea measurements.

Argo floats

Argo floats are large submerged buoys. They are made for profiling the top 2000 m of the world's oceans. The common depth of an Argo floater is approximately 1000 m. Approximately in 10-day intervals they sink to 2000 m depth and afterwards rise to the sea surface, from where broadcast their position and measurement data. Currently, more than 1000 Argo floats are active in the worlds oceans.

The official Argo homepage is here. Here you find a more detailed description of the function of Argo drifters and here you can download drifter measurements.

Gliders

Gliders are one tool for measuring temperature and salinity on vertical transects (actually not a purely vertical transect). Some gliders can go below 1000 m. The disadvantage of a glider is that it needs considerable horizontal space available straight ahead of his direction of motion.

A nice explanation and applications are given here and here.

This is the homepage of the global scientific glider community.
$\endgroup$
3
$\begingroup$

There is a lot of information about temperature bellow 100m and it comes from a variety of sources. Just in the World Ocean Database (https://www.nodc.noaa.gov/OC5/WOD13/) you will find a variety of sources (e.g., XBT, CTD...).

You can download the original data that goes into the temperature fields from: https://www.nodc.noaa.gov/cgi-bin/OC5/wod13/getgeodata.pl?Depth=O&WorldOcean.x=612&WorldOcean.y=192. The data includes:

  • Niskin Bottles: they have been used for decades (the precursor Nansen bottles were developed in 1910) to collect samples of seawater at specific depths. Currently, they are not used that much for temperature as a number of corrections are needed to compensate for the change in pressure, but they are still used for other variables (e.g., chemical and biological analyses).
  • CTD: High resolution Conductivity Temperature Depth sensors use conductivity to determine water temperature (and salinity). They sample much faster and are the standard for temperature sampling.
  • XBT: Expendable bathythermograph have been used since the 1960s and are much cheaper to deploy. They are not that great as deep water sensors as biases are introduced.
  • Profiling float data such as ARGO: They are currently the standard way to measure temperature in the ocean. ARGO has been around since around 2003. The profiling floats drift at (usually) 1000m and every 10 days (usually) dive to a depth of 2000 meters (or even deeper in some cases) and sample conductivity and temperature from there to the surface. From there they send the data to a satellite and then go down to 1000m again.

There are a lot of publications that use the global temperature data. Documentation of the entire database is provided by NOAA.

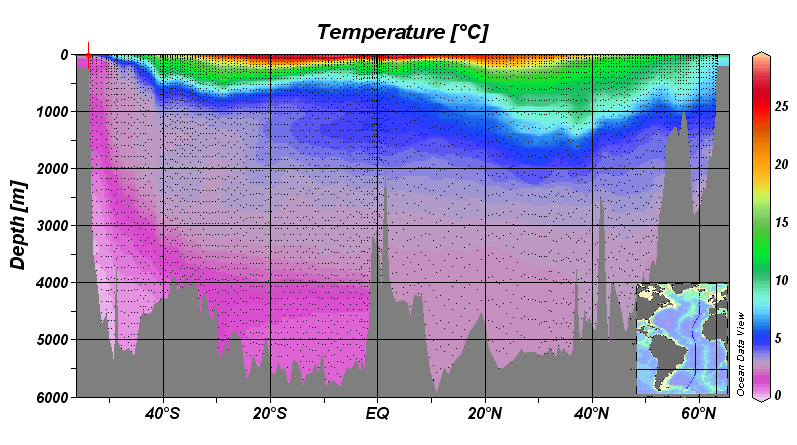
A good representation of the temperature in the deep ocean can be seen in this North-South section. North-south temperature section All the small points are observations. You can see the colder temperatures in the deep South Atlantic associated with the Antarctic Bottom Water versus the temperatures on the deep North Atlantic from the North Atlantic Deep Water.

$\endgroup$
1
$\begingroup$

Thanks @daniel.neuman, I have looked up some profiles to get some data:

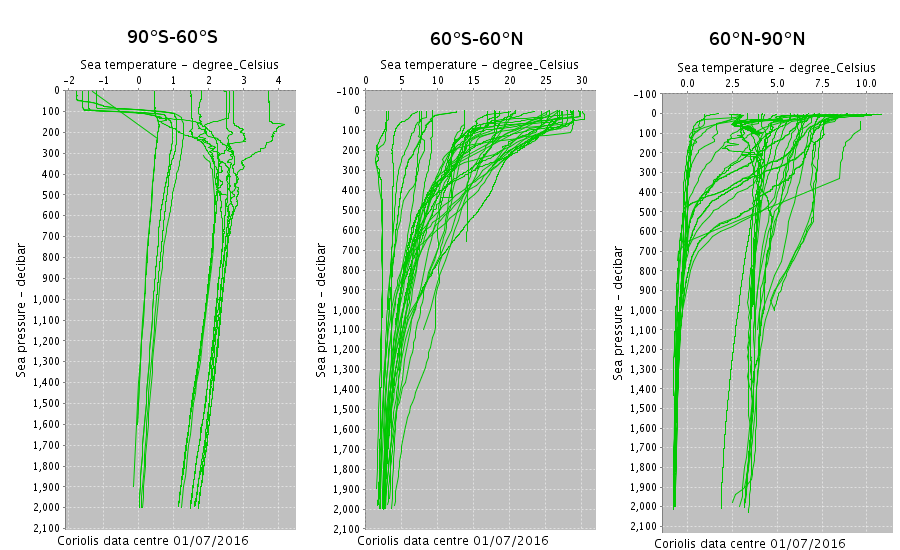
Here we see Sea temperature data as measured by the Argo project buoys on the x-axis as function of the pressure in decibars on the y-axis.
Note that decibars correspond to metres as one delves into water.

I took the data for a period of 1st until 10th of June 2016 (this is one full cycle of the Argo buoys), longitudinally over the whole globe, latitudinally between 60°N and 90°N.
Thus this data includes streams from the arctic (as seen in the colder curves) and the mid-latitudes (the warmer curves). I have checked the other latitudes, between 60°S and 60°N, they essentially look similar to the warm curves seen in here.
Between 90°S and 60°S they look similar, but suprisingly a bit warmer than on the northern hemisphere.

(c) The Argo project (c) The Argo project

$\endgroup$

Your Answer

By clicking “Post Your Answer”, you agree to our terms of service and acknowledge you have read our privacy policy.

Not the answer you're looking for? Browse other questions tagged or ask your own question.