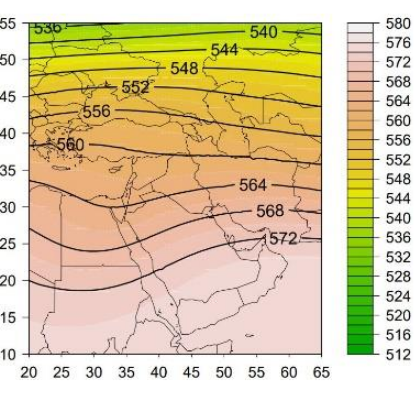
I want to apply PCA to geopotential height (obtained from ERA5) to find the patterns. The way have created the dataset is: The columns are different locations (latitude/longitute) and the rows are different time steps. The values are geopotential height a different location at different times. I ran pca in this dataset I would like to create the maps of the patterns (see the picture an example). I am not sure how to do this. Should I plot the eigenvectors for each PCA as a contour plot? I can see that in the picture there is the geopotential height and not the eigenvectors. Any help woould be great!

$\begingroup$
$\endgroup$
2
-
$\begingroup$ Have you taken a look at the eigenfaces algorithm? That might give you a better idea of how to approach it. $\endgroup$– BarocliniCplusplusCommented Apr 12, 2022 at 11:28
-
$\begingroup$ @les2004 What is your motivation for doing this ? Please show a literature survey that you have done prior to undertaking such problems. $\endgroup$– user1066Commented Apr 13, 2022 at 0:54
Add a comment
|