5
$\begingroup$

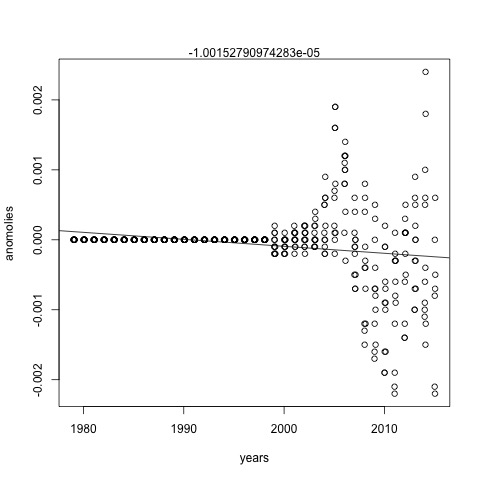
Does anyone know why every month there are updates to the RSS historical atmospheric data? How can data that is 10 years old need adjusting every month?

For instance, here's the difference in data points from July 2015 and October 2015 for the total tropospheric.

enter image description here

$\endgroup$
6
  • $\begingroup$ What is the vertical unit? Relative change? $\endgroup$
    – gerrit
    Commented Oct 16, 2015 at 9:19
  • $\begingroup$ Yes, the vertical axis is just the difference from one month's data point to the other. $\endgroup$ Commented Oct 18, 2015 at 2:59
  • $\begingroup$ What is the source of the above graph? (On what website did you find it?) What exactly does the graph depict? ("Difference in data points from July 2015 and October 2015 for the total tropospheric" doesn't say much.) $\endgroup$ Commented Oct 18, 2015 at 14:26
  • $\begingroup$ @DavidHammen I believe he created the graph himself. $\endgroup$
    – Eubie Drew
    Commented Oct 18, 2015 at 16:24
  • $\begingroup$ David, here's the source of the data: images.remss.com/msu/msu_time_series.html $\endgroup$ Commented Oct 18, 2015 at 19:58

1 Answer 1

4
$\begingroup$

Being remote sensing, algorithms for inverting the raw data to get physical quantities may be improving with time. Perhaps a slight adjustment in algorithm or calibration happened between July and Sept of this year. However you would expect this to introduce a systematic adjustment, not a scatter.

One might reasonably wonder why the data is steady before 1999. That may be because there were fewer (or different) remote sensor parameters measured then, or the data wasn't as precise.

Another possibility is that the calculation was simply done more precisely, and you are looking at the elimination of round off errors, or different round offs.
$\endgroup$
4
  • 1
    $\begingroup$ I do know that over the years the satellites used to gather this data have changed as they reach end of life. So I assume each satellite has different sensors and different paths. But the change in historic data is something I only noticed a few months ago. I had been overwriting my old data file with the current one assuming the data was the same, and thus had to rely upon my backups to get older data. And every single one has changes to historic data. Surely they're not improving their calculations monthly? I'll mark your answer, since I'll likely not get a better. $\endgroup$ Commented Oct 18, 2015 at 2:57
  • $\begingroup$ @user1286792, I might be able to help you better if you tell me what this data entails (chemical abundances, pressures, humidity, wind, reflectance?). The almost white noise dispersion of the anomalies must mean something, but what? another thought, maybe the binning of data is what is changing. $\endgroup$
    – Eubie Drew
    Commented Oct 18, 2015 at 3:08
  • 1
    $\begingroup$ Why can't they be improving their calculations monthly? Remember these instruments are not measuring geophysical parameters directly. They are measuring radiances or electromagnetic scatter, and an algorithm is used retrieve the physical quantities of interest. Like @Aabaakawad mentioned, the instrument calibration and retrieval algorithms can be continually improved. $\endgroup$ Commented Oct 18, 2015 at 7:22
  • 1
    $\begingroup$ For example, electromagnetic interference from man-made sources is a persistent problem and ways to mitigate their contamination to the data is ongoing. It's also true the performance of the instrument itself would slowly deteriorate over time, like you mentioned. If you'd like a definitive answer, I'd reach out to the folks who generated the data. I've contacted folks at RSS before and they have been very helpful. $\endgroup$ Commented Oct 18, 2015 at 7:27

Your Answer

By clicking “Post Your Answer”, you agree to our terms of service and acknowledge you have read our privacy policy.

Not the answer you're looking for? Browse other questions tagged or ask your own question.