11
$\begingroup$

The World Meteorological Organization (WMO) is concerned about the impact of the COVID-19 pandemic on the quantity and quality of weather observations and forecasts, as well as atmospheric and climate monitoring.

Source: https://public.wmo.int/en/media/press-release/wmo-concerned-about-impact-of-covid-19-observing-system

Apparently, meteorological data sent by aircrafts play a big role in establishing weather forecasts. Due to SARS-CoV-2, fewer airplanes than usual are up in the sky, therefore less data is available.

The chart on that page shows a significant decrease in AMDAR data, however, is there any data available on how much this actually increases the prediction error of weather forecasts?

Is there a project that tracks and publishes data regarding weather prediction errors on a regular basis that would help with analyzing the correlation between incoming data and prediction error?

$\endgroup$
1

3 Answers 3

3
$\begingroup$

Welcome to Earth Science SE!

Given that the crisis is still ongoing, I doubt we know the full extent of the impact (forecasting the weather is hard enough, forecasting the impact of a pandemic is outside my expertise). But, at least one conference was supposed t o go to was cancelled. And I know the lack of airplane obs is impacting data assimilation. Beyond that, I am not sure. Some hypotheses perhaps include:

  • Is the change in the quality of life may be impacting forecaster accuracy?
  • What impact does the delay in communication of scientific research have on forecast accuracy?
  • How does this impact the future science budget?
  • How does the absence of airplane data degrade forecasts (could be evaluated using a OSSE experiment)? On a related note, how
  • How is the communication of weather forecasts by in-studio meteorologists compare to meteorologists that are in self-quarantine?

How this ordeal has affected weather forecasts may be a good cross-disciplinary study for the future.

To fully answer your question, you can look at Benjamin et al. (2006) to evaluate the relative impacts of different observational systems. Certainly there have been some changes since then, but this can give a cursory idea of what we might be looking at.

$\endgroup$
4
  • 3
    $\begingroup$ There certainly exist more recent comparisons of the relative impact of DA sources. I'll see if I can ping some of my DA friends for an answer (it's not my field at all). $\endgroup$
    – gerrit
    Commented Apr 3, 2020 at 13:07
  • $\begingroup$ @BarocliniCplusplus Certainly we won't get a full picture yet, but since the AMDAR data started declining at least one month ago, maybe it would be possible to compare the accuracy of predictions from calendar week 12 for week 13 with the accuracy of the predictions from week 9 for week 10 (or earlier this year, or the same weeks last year)? Is there any institution that monitors forecast quality in the long-term? I'll look into the study you posted. $\endgroup$
    – tmh
    Commented Apr 3, 2020 at 13:13
  • 2
    $\begingroup$ Also, wouldn't the reduction of air polution cause differences in the weather for certain areas? (And how much impact does air polution has in the weather?) $\endgroup$ Commented Apr 3, 2020 at 17:22
  • 2
    $\begingroup$ @IsmaelMiguel that is an excellent question,the reduced global dimming might change earths energy balance it might even change it in a significant way. $\endgroup$ Commented Apr 4, 2020 at 14:02
2
$\begingroup$

Is there a project that tracks and publishes data regarding weather prediction errors on a regular basis that would help with analyzing the correlation between incoming data and prediction error?

The World Meteorological Organization has several initiatives that track forecast performance. See for example here. The data is a bit delayed, as of today (Apr 5, 2020) the latest month available is February, which was before the strong decrease in AMDAR data.

For assessing forecast performance, one will need to find a forecast field for plotting and a certain metric. As forecast field I like to look at the 500 hPa geopotential height, since this is linked to the atmospheric flow, which itself largely determines surface weather. A suitable metric is the Anomaly Correlation Coefficient (ACC) which basically describes how well the predicted field correlates with the field as it was observed later on at the time for which the prediction was valid.

An intuitive way then to visualize these results, is to look at the forecast lead time at which the forecast reaches a certain threshold of ACC. In the example below this threshold is chosen to be 80%. So one could read the chart as 'how far the model was able to predict ahead', or in short 'predictability'.

The figure below (source: ECMWF) shows monthly means for this 'Day where ACC=80% is reached' over the Northern Hemisphere. Note the strong seasonal cycle with predictability being much higher in winter compared to summer for the Northern Hemisphere.
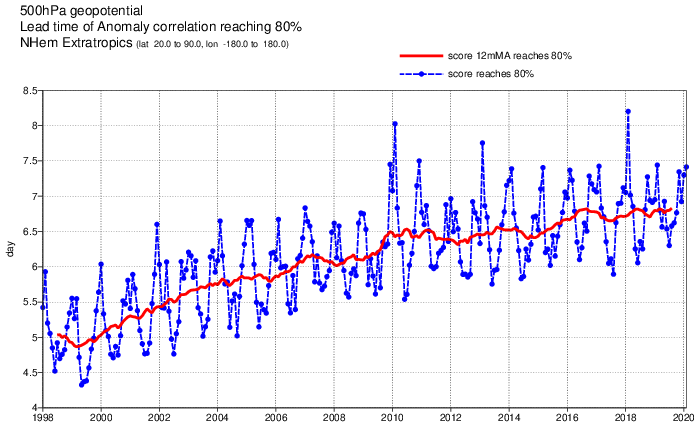
ECMWF ACC The large seasonality, strong year-to-year variability and in addition overall increases of forecast performance over time (with the model itself being improved over time as well!) will likely make it difficult to attribute any changes of the performance over time to the lower AMDAR coverage.

However, there have been several studies analyzing the relevance of different input data (including AMDAR) to the forecast models. I found for example this presentation. Although this is no conclusive answer to your question, I hope I provided some useful resources.

$\endgroup$
2
  • $\begingroup$ Still this information is very useful for answering the question. We just need to wait 1-2 months until they publish more recent data. $\endgroup$
    – tmh
    Commented Apr 5, 2020 at 14:26
  • $\begingroup$ @tmh Nobody knows if the weather forecast 5 days ahead is accurate until those 5 days have passed... $\endgroup$
    – gerrit
    Commented Apr 6, 2020 at 20:46
2
$\begingroup$

The ECMWF (European Centre for Medium-Range Weather Forecasts) has published an article about the topic on 24 March 2020:

By 23 March there was a reduction of 65% in [European aircraft] reports received compared to 3 March. Globally the reduction was about 42%. [...]

In 2019 a test was run: a series of forecasts without using aircraft reports (but with all other data) [...], compared to using all data (i.e. including aircraft reports). [...]

12-hour temperature forecasts in the northern hemisphere are more than 9% worse at cruise levels. [...]

"Removing half the aircraft reports would be expected to give slightly less than half the impact of removing all aircraft," says ECMWF scientist Bruce Ingleby. [...]

In summary, the number of aircraft observations has gone down significantly over the last couple of weeks both over Europe and globally. In the coming days and weeks, we expect a further decrease in numbers, which will have some impact on forecast quality in the short range, particularly around the polar jet stream level (10-12 km altitude).

Sensitivity studies at ECMWF have shown that removing all aircraft data degrades the short-range wind and temperature forecasts at those levels by up to 15%, with significant degradations at all forecast ranges up to seven days. There is a smaller, but still statistically significant, impact on near-surface fields, up to 3% on surface pressure.

Other types of observations are likely to be less affected by the COVID-19 disruption than aircraft reports, and there may be some additional radiosonde launches to try to mitigate the lack of aircraft data.

(emphasis mine)

Source: https://www.ecmwf.int/en/about/media-centre/news/2020/drop-aircraft-observations-could-have-impact-weather-forecasts

$\endgroup$

Your Answer

By clicking “Post Your Answer”, you agree to our terms of service and acknowledge you have read our privacy policy.

Not the answer you're looking for? Browse other questions tagged or ask your own question.