Need temperature for 24 hours for each county of United States. Average values is ok, seasonal granularity welcome. I've been looking at nClimDiv datasets
-
$\begingroup$ Worth noting that counties in the United States range from ~ 13 square miles to 20,100 square miles. The largest, such as San Bernardino County, have a mix of climates, so there's no probably no single representative value. $\endgroup$– jeffronicusCommented Feb 7, 2020 at 15:59
-
$\begingroup$ @jeffronicus: There's also quite an elevation range within counties. I can be in fairly warm sunshine here in the valley, while watching a snowstorm in the nearby mountains - or at other times, be skiing in the sun on those mountains while the valley is covered in fog, or even pogonip: en.wikipedia.org/wiki/Ice_fog $\endgroup$– jamesqfCommented Feb 7, 2020 at 18:46
1 Answer
You can get this from the Integrated Surface Dataset (ISD).
First get a list of all weather stations from ftp://ftp.ncdc.noaa.gov/pub/data/noaa/isd-history.txt:
stations = pandas.read_fwf("ftp://ftp.ncdc.noaa.gov/pub/data/noaa/isd-history.txt",
                           skiprows=20, parse_dates=["BEGIN", "END"],
                           skip_blank_lines=True,
                           dtype={"WBAN": "O"})
Then select the ones in the USA:
stations_us = stations[stations["CTRY"]=="US"]
That give us 7326 stations. Although the state of each station is described, the county is not. To get the county you will need to combine the lat/lon for each station with a county database. That is a bit beyond the scope of Earth Science SE, but maybe you can get help at GIS SE. The station ID is a combination of two fields:
ids = stations_us["USAF"] + stations_us["WBAN"]
We can then download the measurements for a particular year from AWS S3:
meas = pandas.read_csv(f"s3://noaa-global-hourly-pds/2020/{ids.iloc[200]:s}.csv", parse_dates=["DATE"])
And extract temperatures:
temps = meas.TMP.str.extract(r"([+-]\d{4}),([012345679ACIMPRU])")[0].astype("f4")/10
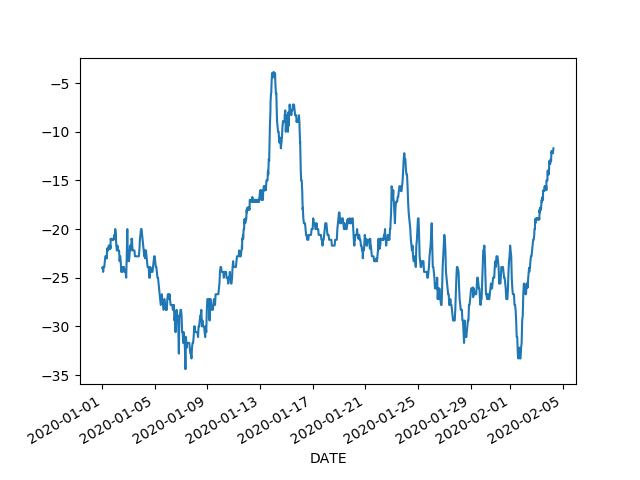
Let's get the valid ones (there's a 9999 fill value) and plot:
valid = temps<999
meas[valid].set_index(meas.DATE[valid])["temps"].plot()
Enjoy!
For a description of the fields, see the ISD Format Document at https://www.ncei.noaa.gov/data/global-hourly/doc/isd-format-document.pdf .
-
$\begingroup$ Thank you so much! This is kind of what I am looking for. However, I ran your code and it only gives readings for Anvik Airport, Alaska. I'm guessing, I should loop over all station codes to get a representative profile for each and then match them to each county. Is there github documentation for AWS S3 + NOAA? $\endgroup$ Commented Feb 7, 2020 at 2:58
-
$\begingroup$ @masaladosa It gives Anvik because of the line
ids.iloc[200]— station 200 happens to be Anvik. You'll want to inspect thestationsDataFrame to select stations of interest to you (about half the stations are historical, but the stations DataFrame contains date lists). I've linked the ISD page and format documentation, you'll find the AWS ISD page here. There's a lot on AWS S3 around but if you use pandas to read it directly you don't need it. In case you're not familiar with pandas you can use their excellent tutorial (I'm quite new myself). $\endgroup$– gerrit ♦Commented Feb 7, 2020 at 8:36 -
$\begingroup$ Thanks a lot! I think I found what I was looking for deep into their documentation. I'll clean the data and upload for others to use shortly. $\endgroup$ Commented Feb 10, 2020 at 22:28
